After Repair Value (ARV): The Investor's Complete Guide to Calculating What a Property Is Really Worth in 2026
After Repair Value (ARV): The Investor's Complete Guide to Calculating What a Property Is Really Worth in 2026
TL;DR: After repair value (ARV) is the estimated market value of a property after all repairs and renovations are complete. It is calculated by analyzing recent comparable sales of similar homes in similar condition, then adjusting for differences in size, features, and location. The standard MAO formula is ARV multiplied by 0.65 minus rehab costs. Getting this estimate wrong is the most common reason house flips fail, and the fastest path to accuracy is using county-assessor-verified property data combined with at least three closed comps from the past 90 days.

The Number That Makes or Breaks Every Flip
Most investors who lose money on house flips do not lose it in the renovation. They lose it before they swing a hammer. They overpay because their ARV estimate was wrong. The math looked fine on a spreadsheet. The market said something different.
A property purchased at 70% of ARV with 25% rehab costs leaves a flipper with 5% margin before carrying costs, agent fees, and closing costs eat the rest. That is not a bad market. That is a bad calculation.
The investors who consistently profit are not necessarily better negotiators or better contractors. They are better at ARV. They find comparable sales that actually reflect what the finished property will be worth, and they know which data sources to trust when the numbers diverge by hundreds of square feet.
What Is After Repair Value?
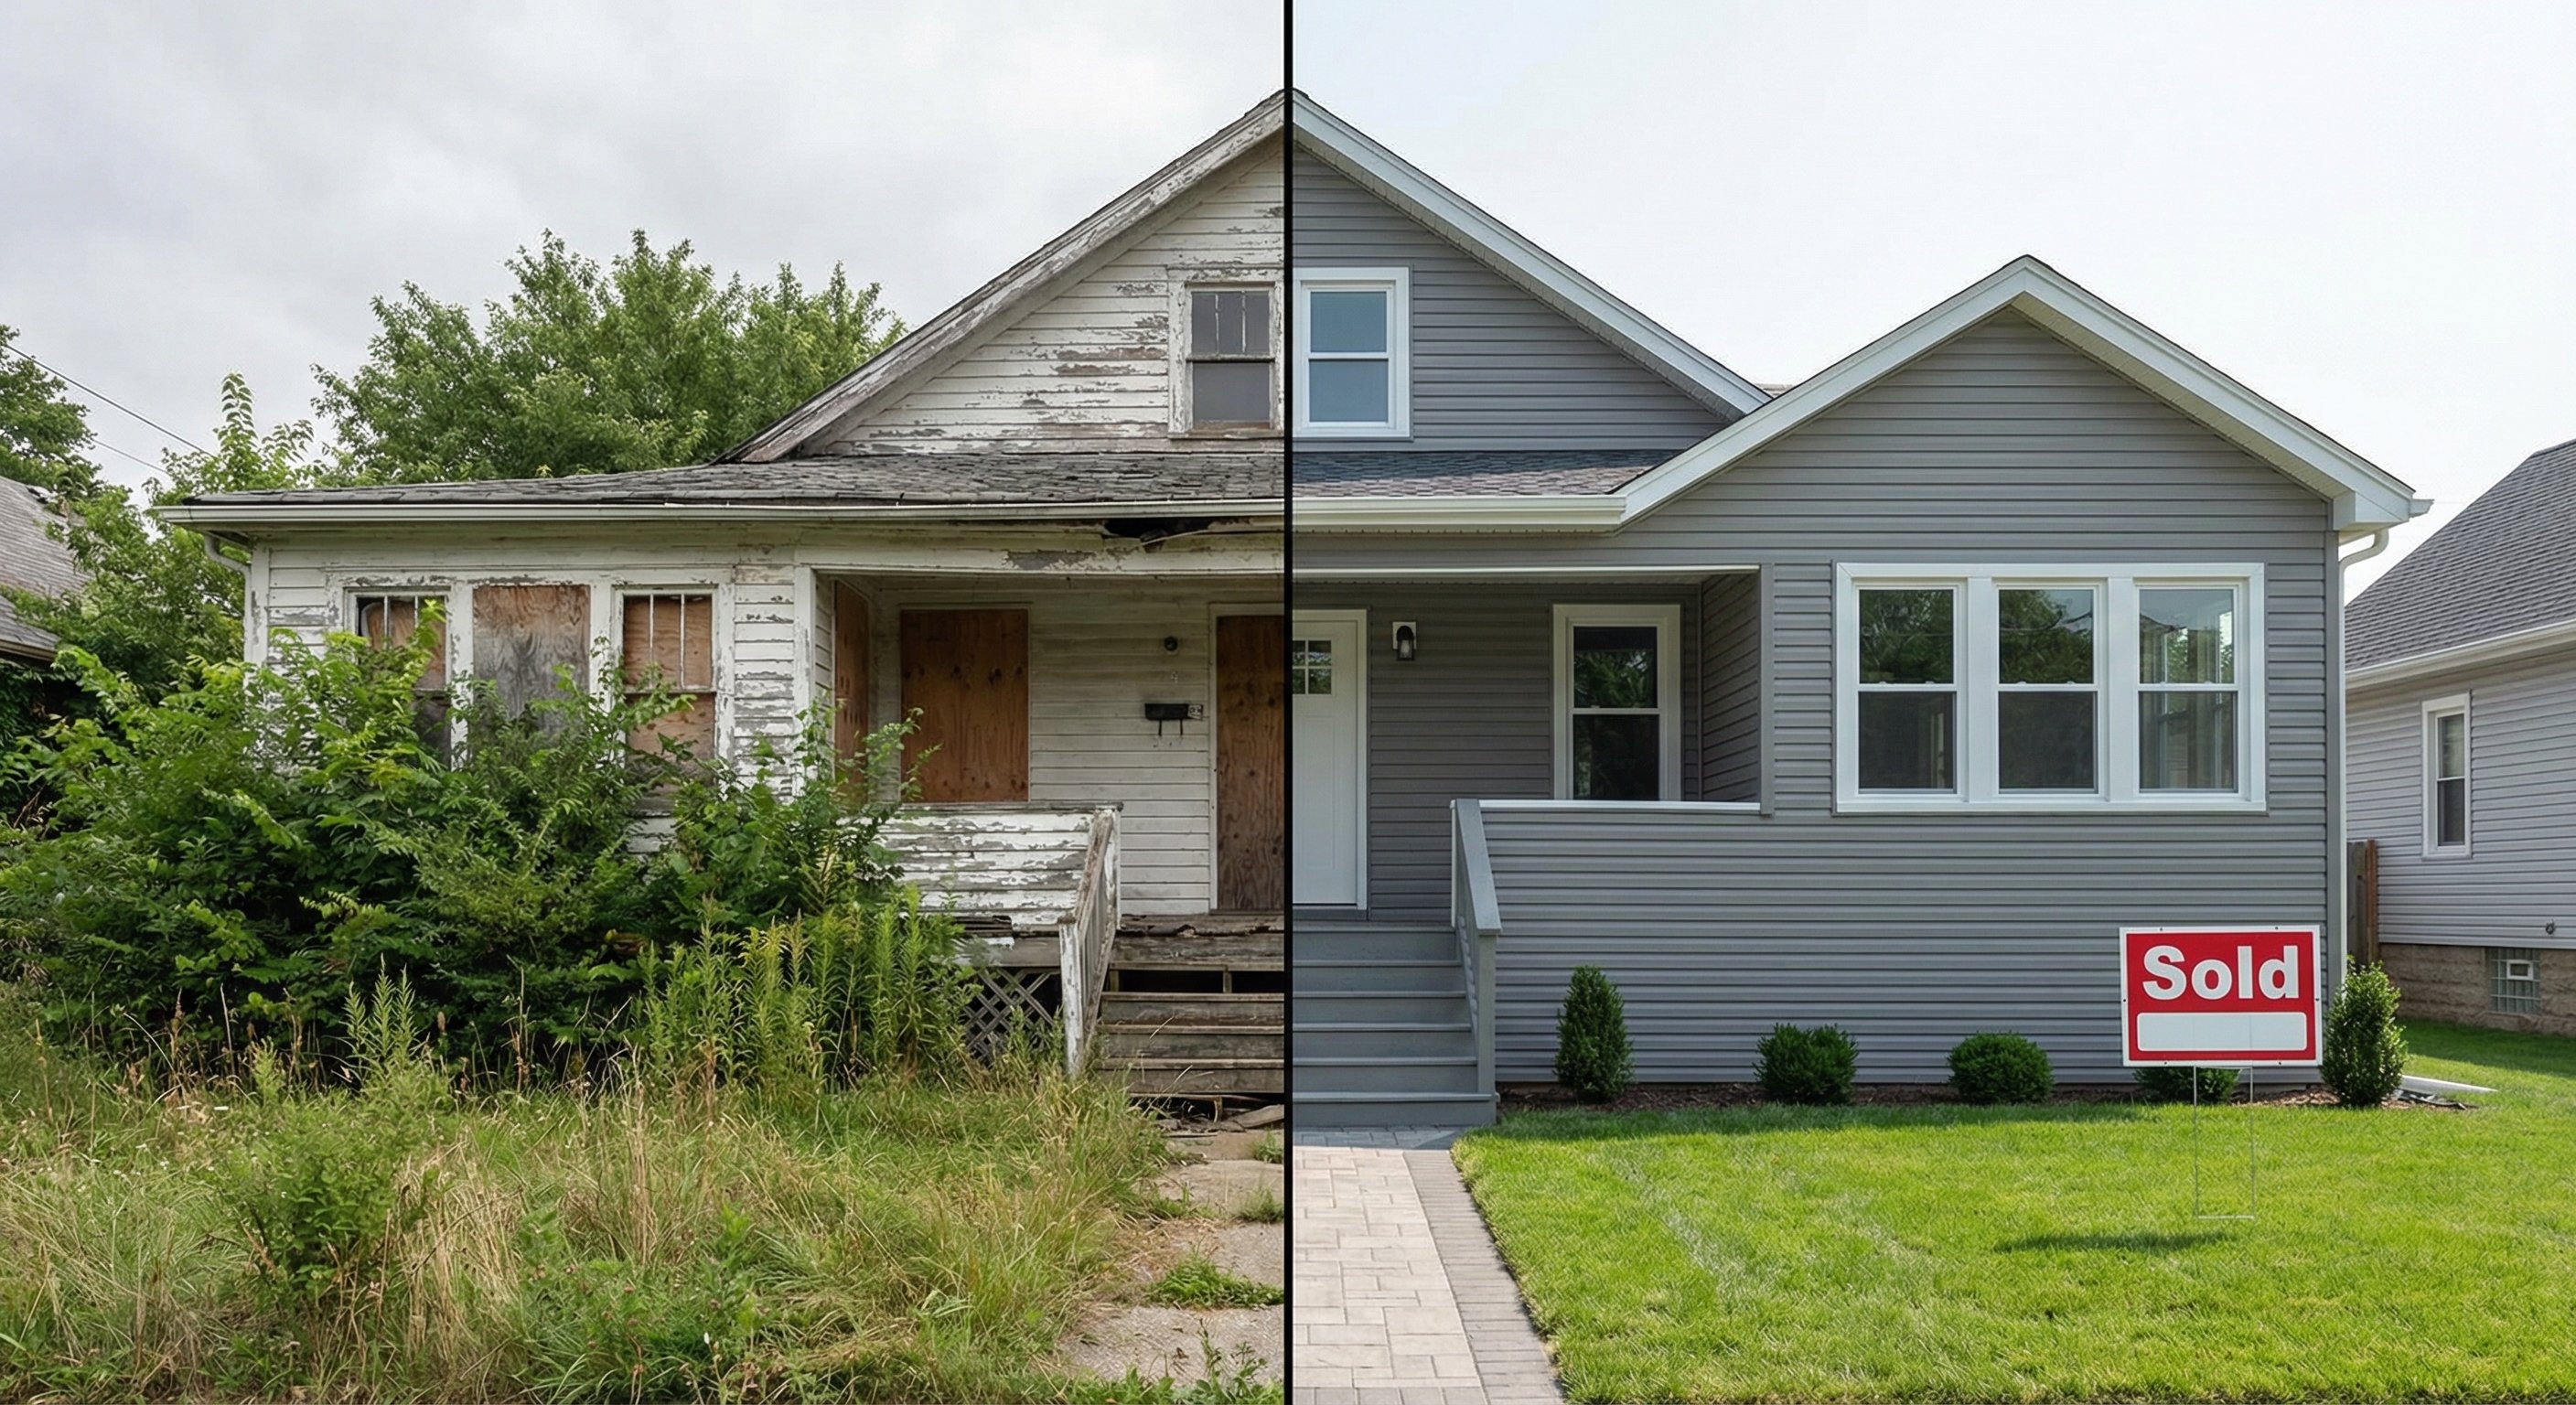
ARV is the estimated fair market value of a property after all intended repairs and improvements are complete. It represents what a willing buyer would pay for the finished home on the open market.
The gap between as-is value and ARV is where profit lives. Investors call this the equity spread, and it is the fundamental opportunity in distressed property investing.
ARV applies to fix and flip, wholesale, buy-and-hold, and note investing. Every strategy requires the same foundational number. Get it wrong, and every downstream calculation compounds the error.
The MAO Formula
The standard house flip analysis formula:
Maximum Allowable Offer (MAO) = (ARV x 0.65) minus Rehab Costs
The 65% rule leaves a 35% cushion for holding costs, selling fees, financing, and profit. In hot markets like Phoenix or Tampa, investors work with 70% to 75% of ARV. In slower markets with longer hold times, 60% to 65% keeps the margin intact.
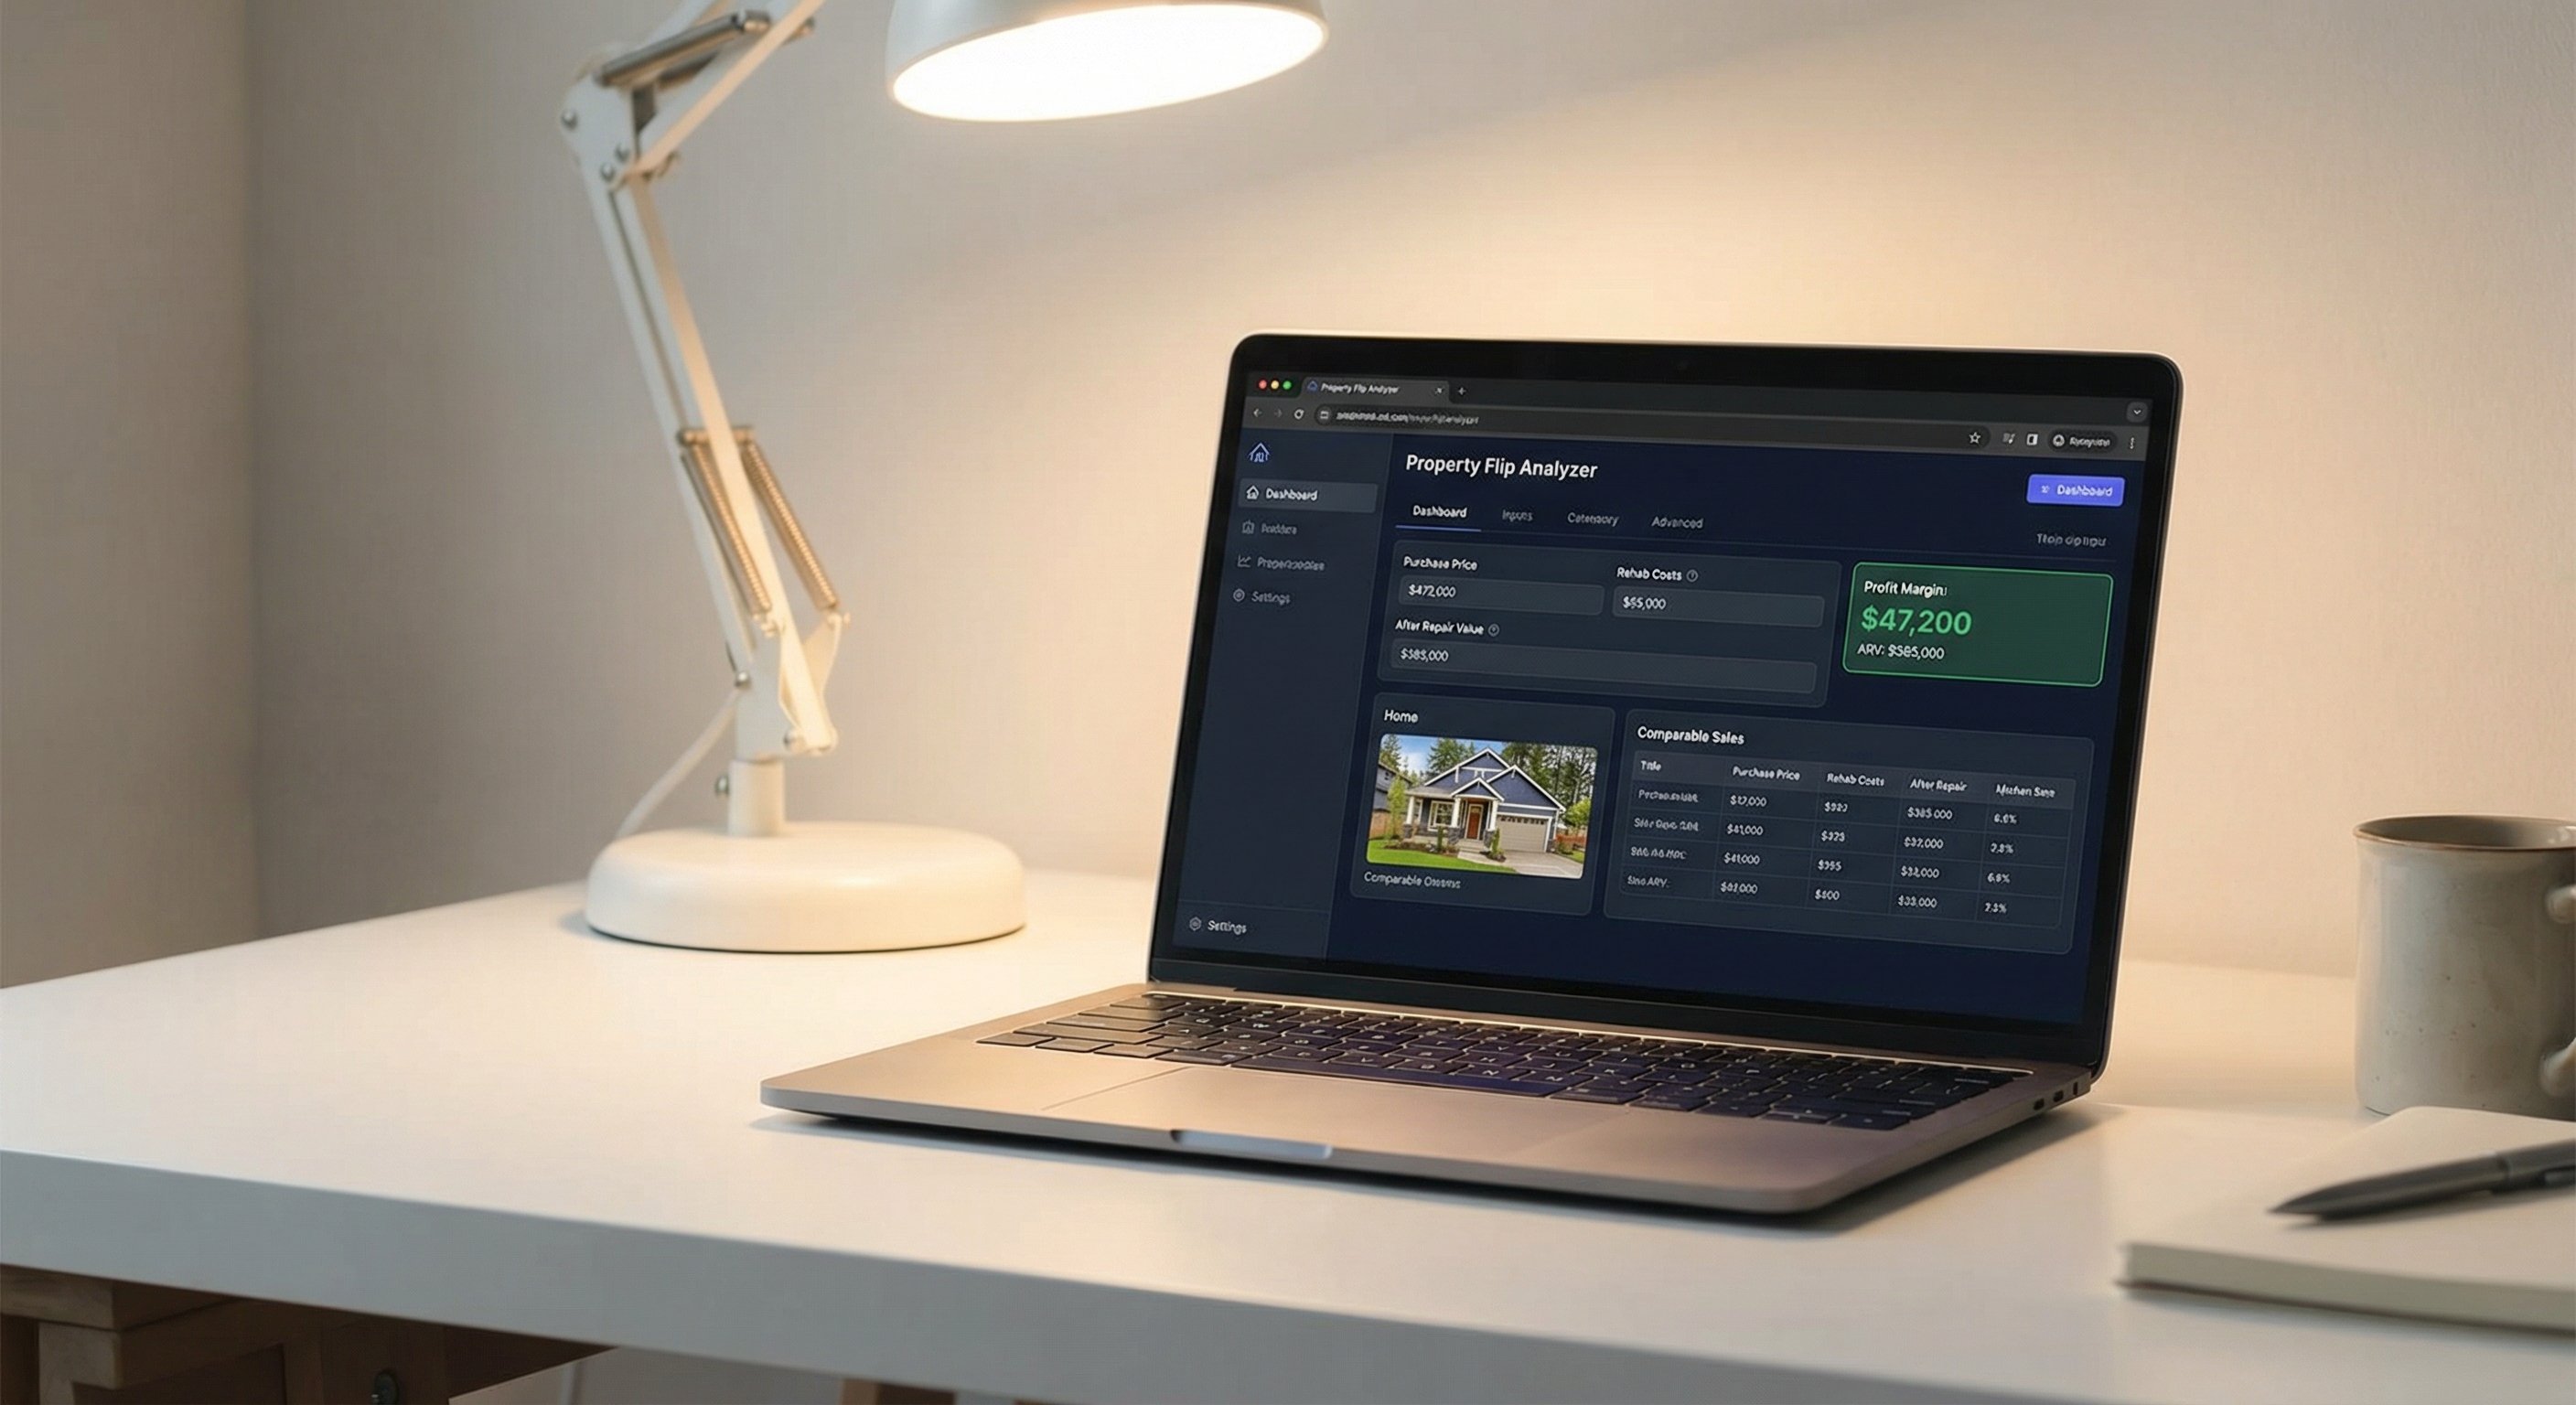
Here is a real example. ARV of $385,000 and $45,000 in estimated rehab:
- MAO at 65%: ($385,000 x 0.65) minus $45,000 = $205,250
- MAO at 70%: ($385,000 x 0.70) minus $45,000 = $224,500
That is nearly $20,000 in different allowable offer based on a 5-point adjustment to the ARV percentage. The ARV number itself is the leverage point.
Free Weekly Alerts
See What's Distressed in Your Market
Get free weekly alerts — new distressed properties, motivation scores, and hot neighborhoods in your area. Addresses and contact info available inside DistressIQ.
Free forever · No credit card · Unsubscribe anytime
Finding Comparable Sales That Actually Matter
ARV is only as good as the comps used to calculate it. The most common mistake is using the wrong comps or comps from unreliable data.
Stick to the Past 90 Days
Real estate markets move. Always use the most recent 90 days of closed sales as your primary comp set. Pending and active listings can supplement the analysis but should not replace closed sales.
Screen Comps on Three Criteria
First, square footage proximity. The comp should be within 200 square feet of the subject property is finished size. Second, bedroom and bathroom count match. Third, lot size and location similarity. Every micro-market has its own pricing dynamics, and crossing into a different school district or neighborhood type requires explicit adjustment.
The Data Source Problem Most Investors Ignore
The most frequently used data source for comparable sales is MLS. It is also frequently wrong on property characteristics. Investor forums are full of stories about MLS square footage being 20% to 30% higher than the county assessor is actual record. A property listed at 2,400 square feet on MLS may be assessed at 1,890 square feet by the county.
When MLS and county assessor data disagree, the county record is the legal document. MLS data is self-reported by listing agents and has no legal standing. If you calculate ARV based on MLS square footage that overstates the actual size, your comparable sale price per square foot will be inflated, pushing your ARV estimate too high.
Using county assessor-verified property characteristics as the baseline for your comp analysis gives you the same data the county uses to calculate property taxes. The legal record of what a property actually contains is more reliable than a listing agent is best guess.
Common ARV Mistakes That Kill Deals
Using Automated ARV Estimates
Automated valuation models like Zestimate and Redfin Estimate are built on MLS and public record data. They can be off by 10% to 30% on distressed homes, unique floor plans, and non-standard properties. No algorithm can account for the specific condition of a distressed property or the quality of a planned renovation. AVM estimates are a starting point, not an answer.
Using Comps From the Wrong Neighborhood
Every neighborhood has its own micro-market. Using comps from a zip code with larger lot sizes, newer construction, or different school ratings will systematically skew the ARV estimate. Keep comps within the same or adjacent neighborhoods and adjust explicitly when crossing a micro-market boundary.
Failing to Adjust for Condition
A comp that sold in move-in condition is not directly comparable to a property that needs full gut renovation. Adjust the comp downward to reflect the difference between a finished home and a distressed one. The standard rule is to deduct the full estimated rehab cost from the comp sale price to derive a realistic as-is baseline, then add your planned improvements to arrive at ARV.
Ignoring Active Competition
Closed sales tell you where the market was. Active and pending listings tell you where the market is going. If three similar homes are currently listed at $410,000 but the last closed sale in the area was $375,000, the market has moved. The ARV estimate must account for current competitive inventory.
How DistressIQ Helps Investors Find Properties Below ARV
The DistressIQ platform surfaces properties where a verifiable gap exists between current distressed value and after repair value. Every lead carries at least one verified distress signal from county records, including tax delinquency, code violations, pre-foreclosure filings, and more.
The platform layers in assessor-verified property characteristics from county tax records, which means the square footage, lot size, bedroom count, and bathroom count used in comp selection come from the legal record, not MLS self-reports. Property data is updated multiple times daily from county sources. The motivation score ranks properties by the strength of their distress signals, surfacing candidates where accurate ARV analysis creates the opportunity.
See distressed properties with verified county data across 3,200+ counties at DistressIQ. Browse free. Only export and skip tracing cost actions.
ARV Benchmarks by Market Type
ARV estimates behave differently across market types. In high-appreciation markets like Phoenix, Tampa, and Austin, rapid price gains can make conservative ARV estimates essential, because appreciation can reverse. Investors should build wider margins of safety into their MAO calculations even when comps look strong. In stable Midwest markets like Columbus and Indianapolis, ARV estimates are typically more defensible over 12-month periods because the comparable sales base is less noisy. In slow markets and Rust Belt cities like Detroit and Cleveland, distressed properties may trade at 40% to 50% of replacement cost, and the comparable sales base is often thin. Local market expertise matters more than anywhere else in these environments.

Building Your ARV Workflow
The workflow has six steps. First, pull the subject property is county-assessed square footage, lot size, beds, and baths. Second, identify three to five comparable properties that sold in the past 90 days within 200 square feet of the subject is size, with matching bedroom and bathroom counts, in the same or adjacent neighborhood. Third, calculate price per square foot for each comp, average the three most comparable, and multiply by the subject property is assessed square footage to get your base ARV estimate. Fourth, adjust for features and condition. Add or subtract value for features the comps have that the subject will not have after renovation. Fifth, run the MAO formula. Sixth, stress-test the ARV by running the formula at 90% of your estimate. If the deal still works conservatively, it is worth pursuing.
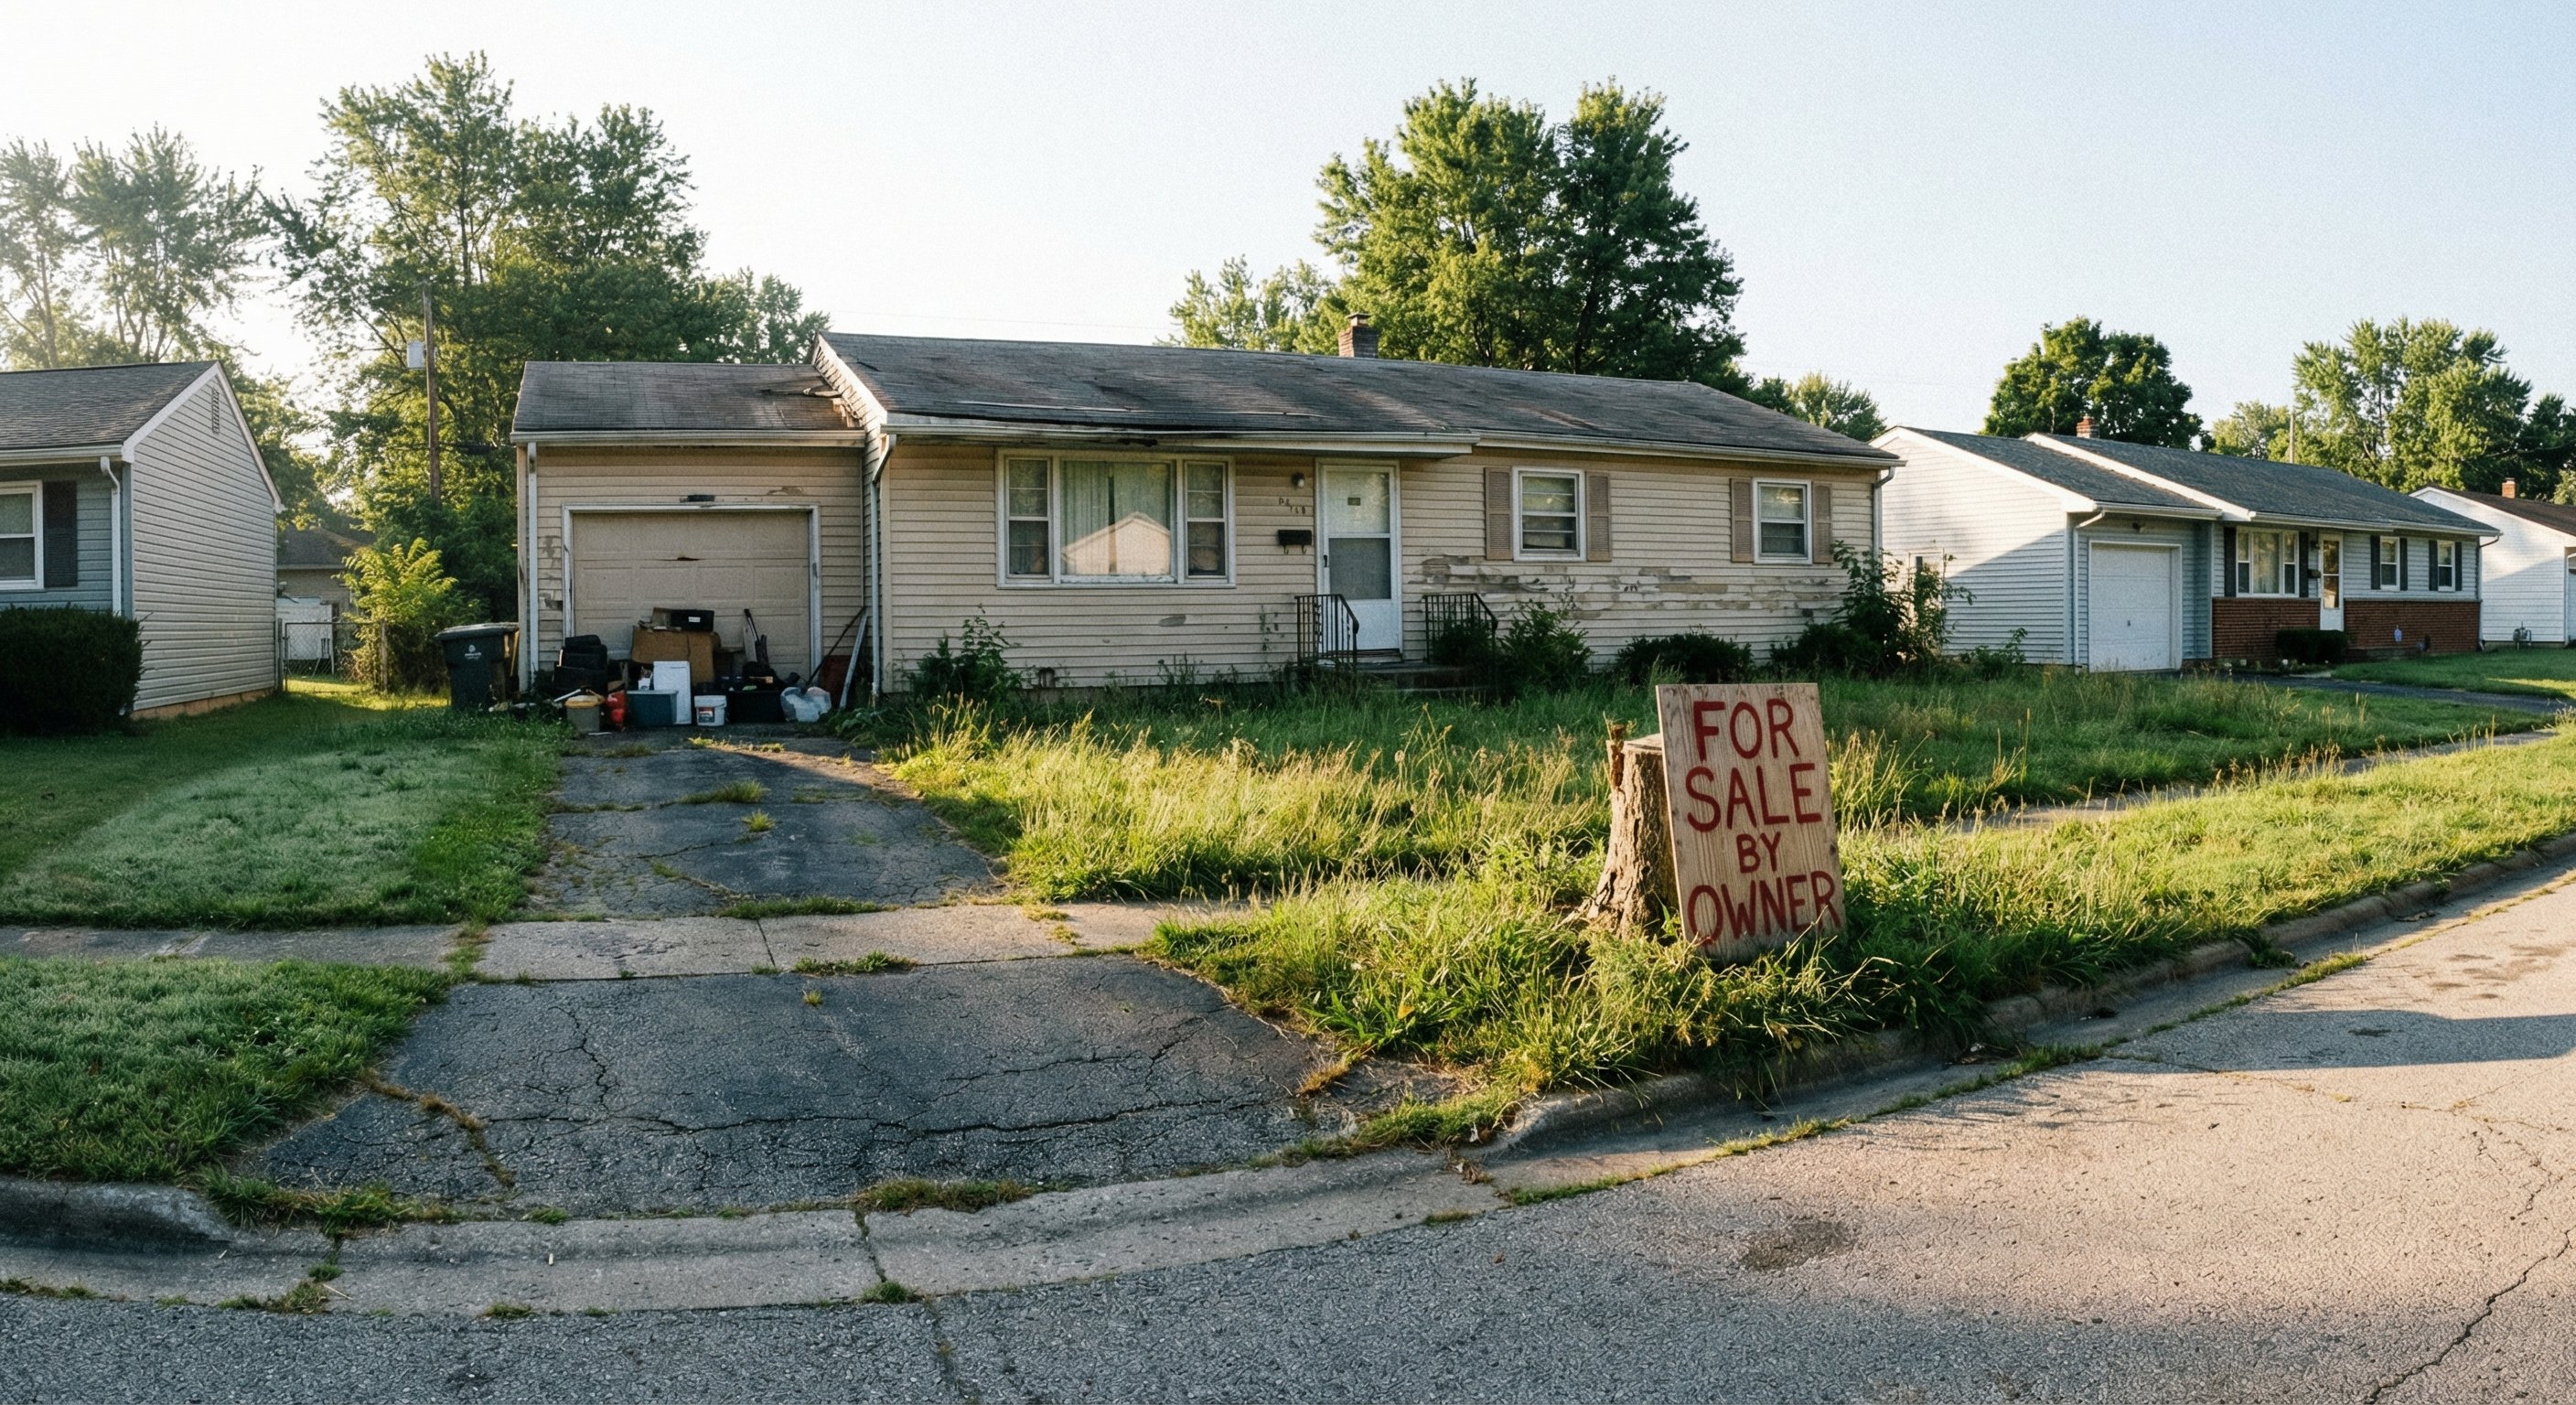
The Distressed Property and ARV Connection
Distressed properties often sell at discounts to their ARV because buyers who need conventional financing cannot easily purchase them. Cash investors and house flippers who can close quickly and as-is are the natural buyer pool for distressed properties.
The discount to ARV depends on the distress type. Tax delinquent properties often trade at 15% to 35% below ARV, depending on the state and county process and redemption timeline. Pre-foreclosure properties may trade at 10% to 25% below ARV, particularly when the homeowner needs to close quickly. Probate and estate properties often trade at 5% to 20% below ARV, depending on the settlement timeline. Code violation properties trade at varying discounts depending on violation severity and whether the municipality has filed liens.
The core of the house flip business model is finding a property at 60% to 65% of ARV with rehab costs that leave a positive MAO. Platforms that surface distressed properties with verified distress signals and accurate property characteristics give investors the data to run that calculation on a property-by-property basis.
Frequently Asked Questions
Q: What is the 70% rule in house flipping?
The 70% rule states that an investor should pay no more than 70% of a property is ARV, minus estimated repair costs. It is a more conservative version of the 65% rule. The right percentage depends on local market conditions, expected hold time, and risk tolerance. In fast-moving markets with short hold times, 70% to 75% can work. In slower markets, 60% to 65% is more appropriate.
Q: How do I find comparable sales for a distressed property?
Start with the county assessor is record to confirm accurate square footage and bedroom and bathroom counts. Pull closed sales from the past 90 days within 200 square feet of the subject is size in the same neighborhood. Adjust explicitly for features that differ between the comps and the subject is planned finished condition. Always verify MLS data against the county record before using it.
Q: Can I use ARV for a buy-and-hold strategy?
Yes. ARV represents the future value of the property if sold after renovations. Knowing ARV helps frame the long-term equity position, the potential for a cash-out refinance after renovations, and whether the purchase price makes sense relative to replacement cost.
Q: How accurate are online ARV estimates like Zillow is Zestimate?
Most automated valuation models are accurate within 5% to 10% on standard homes in active markets. They become significantly less reliable on distressed properties, unique floor plans, and homes in low-transaction markets. AVM estimates should always be verified against county assessor records and a manual comparable sales analysis before making an offer.
Q: How does county assessor data improve ARV accuracy?
County assessor records are the legal basis for property taxation and are maintained with legal accountability for accuracy. MLS data is self-reported by listing agents and frequently contains errors in square footage and bedroom count. When the county record and MLS listing disagree, the county record is the more reliable figure.
Q: What is the difference between current value and after repair value?
Current value, sometimes called as-is value, is what the property would sell for today in its current distressed condition. ARV is what the property would sell for after all intended repairs and renovations are complete. The investor is profit opportunity exists in the gap between the as-is purchase price and the ARV exit price.
The Bottom Line on ARV
ARV is not a fixed number. It is an estimate, and every estimate contains uncertainty. The investor is job is to build an ARV analysis process that is rigorous enough to rely upon, conservative enough to survive unexpected conditions, and consistent enough to apply across a portfolio of deals.
The most important habits for accurate ARV are: use county-assessor-verified property characteristics as the foundation, stick to 90-day closed comps in similar condition, adjust explicitly for every meaningful difference between comps and subject property, and stress-test the deal at 90% of the estimated ARV before committing.
Every distressed property has an ARV. The question is whether the investor calculated it correctly before making an offer. Find distressed properties with verified distress signals and county-assessor data at DistressIQ and start running your ARV analysis on properties where the gap between current distressed value and after repair value is already visible.
The data behind this article
DistressIQ Monitors These Signals in Real Time
Pre-Foreclosures
NOD + NTS filings
Tax Delinquency
County treasurer records
Code Violations
Municipal inspection filings
Probate Filings
Superior Court records
Every lead is scored 0–100 for seller motivation based on signal type, duration, severity, and stacking. Nationwide coverage — every US county, updated daily.
Ready to find deals in your market?
See Live Distress Signals in Your County
Stop calling dead leads. Every lead in DistressIQ is scored 0–100 for seller motivation, with verified contact info included. Browse the free tier to see what's active in your market right now.
Browse Free Leads — No Credit Card