Fix and Flip Real Estate: The Complete Investor's Guide to Renovation Profits in 2026

Fix and Flip Real Estate: The Complete Investor's Guide to Renovation Profits in 2026
TL;DR: Fix and flip real estate generates consistent profits when investors buy at no more than 70% of after-repair value, nail their ARV estimate with accurate neighborhood comps, and control renovation costs with a detailed scope of work. Most failures trace to overpaying at purchase, underestimating renovation scope, or letting projects run past timeline. A solid mid-market flip should deliver $50,000 to $70,000 in gross profit over five to seven months.
The house flipping shows on cable TV make it look simple: buy low, renovate, sell high. The reality is brutal. A 2024 Real Estate Witch survey found that 36% of fix-and-flip investors lost money on at least one project in the prior two years. Of those who lost money, 68% blamed the same three causes: paying too much at purchase, underestimating renovation costs, or projects running longer than planned.
Those are fixable problems. The decision that determines profitability is made at the purchase stage.
Why Purchase Price Discipline Determines Everything
An investor who buys at 85% of ARV can run a mediocre renovation and still profit. An investor who buys at 95% of ARV needs flawless execution just to break even.
The standard rule: buy at no more than 70% of after-repair value, minus estimated renovation costs. That gives a 30% gross margin to cover holding costs, closing costs, financing fees, and the inevitable surprises that arise during construction. Some investors in hot markets stretch to 75% of ARV, but that margin compression requires tighter execution on every variable.
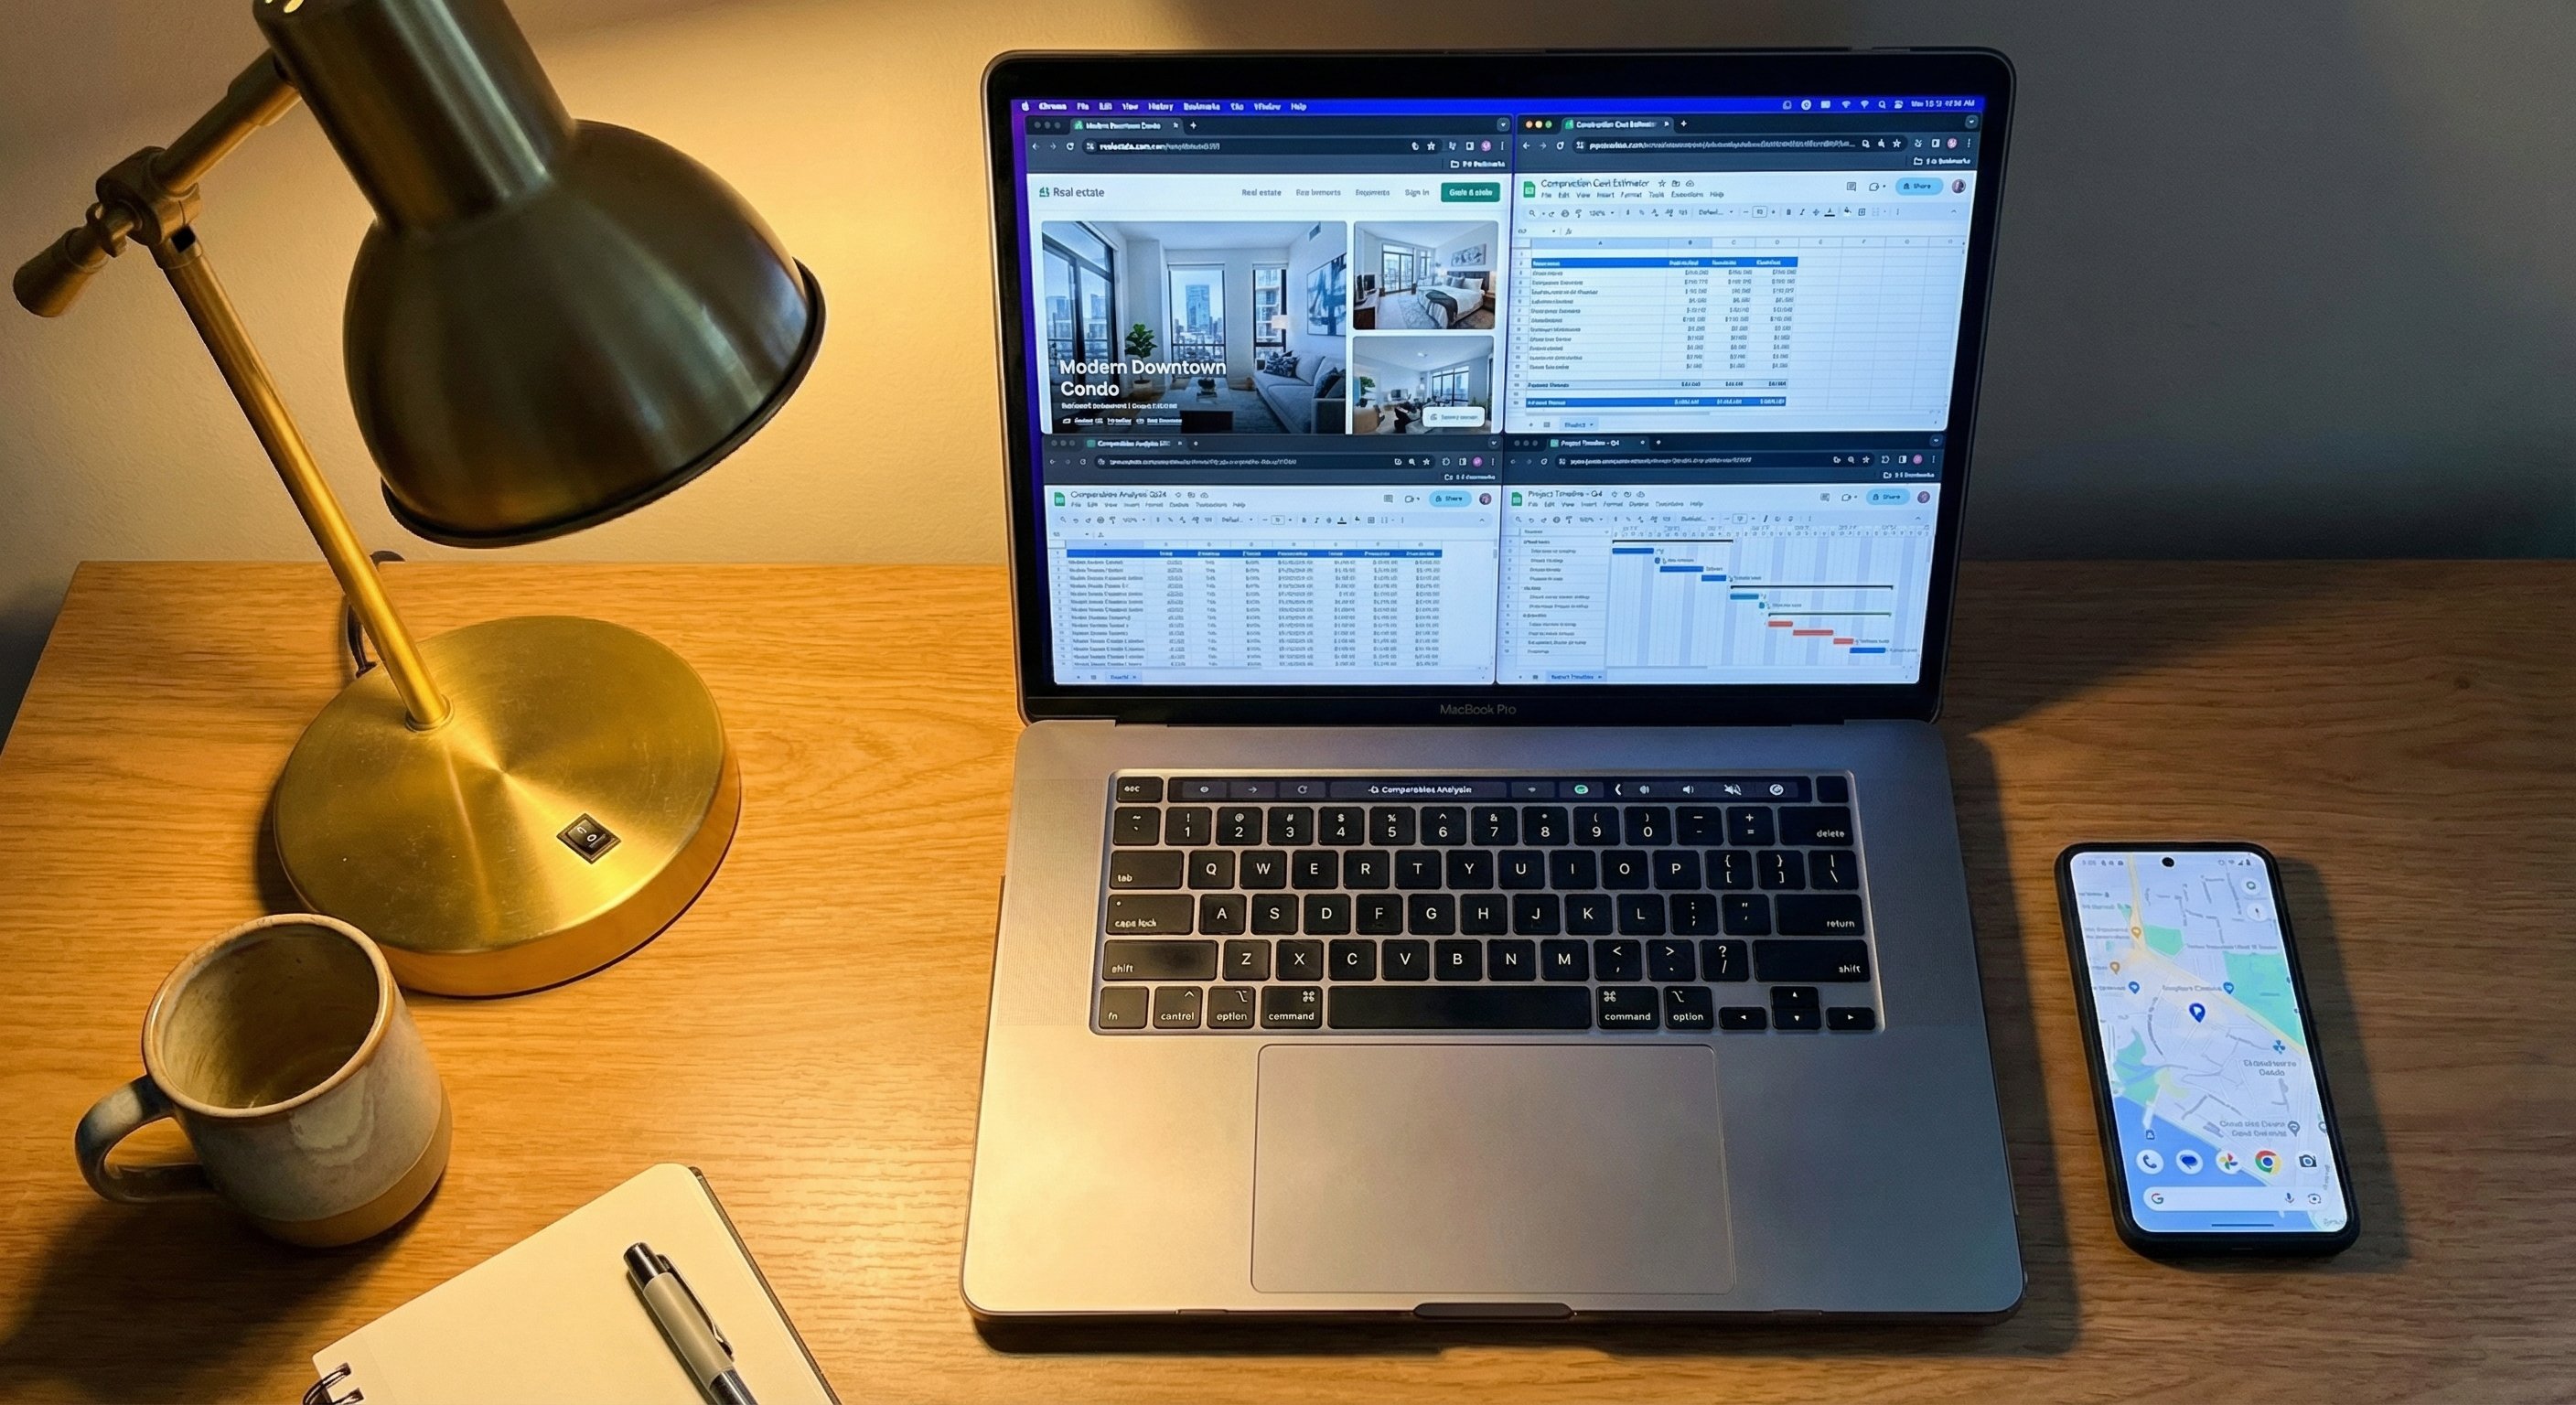
ARV accuracy is the second filter. After-repair value is not what the seller hopes the property will fetch. It is what comparable properties with similar upgrades actually sold for in the past 90 days. Experienced flippers pull at least three to five comps from the subject property's specific neighborhood. County assessor records showing accurate square footage help avoid the common mistake of relying on listings with fabricated bedroom counts.
Finding the Right Properties for Fix and Flip Deals
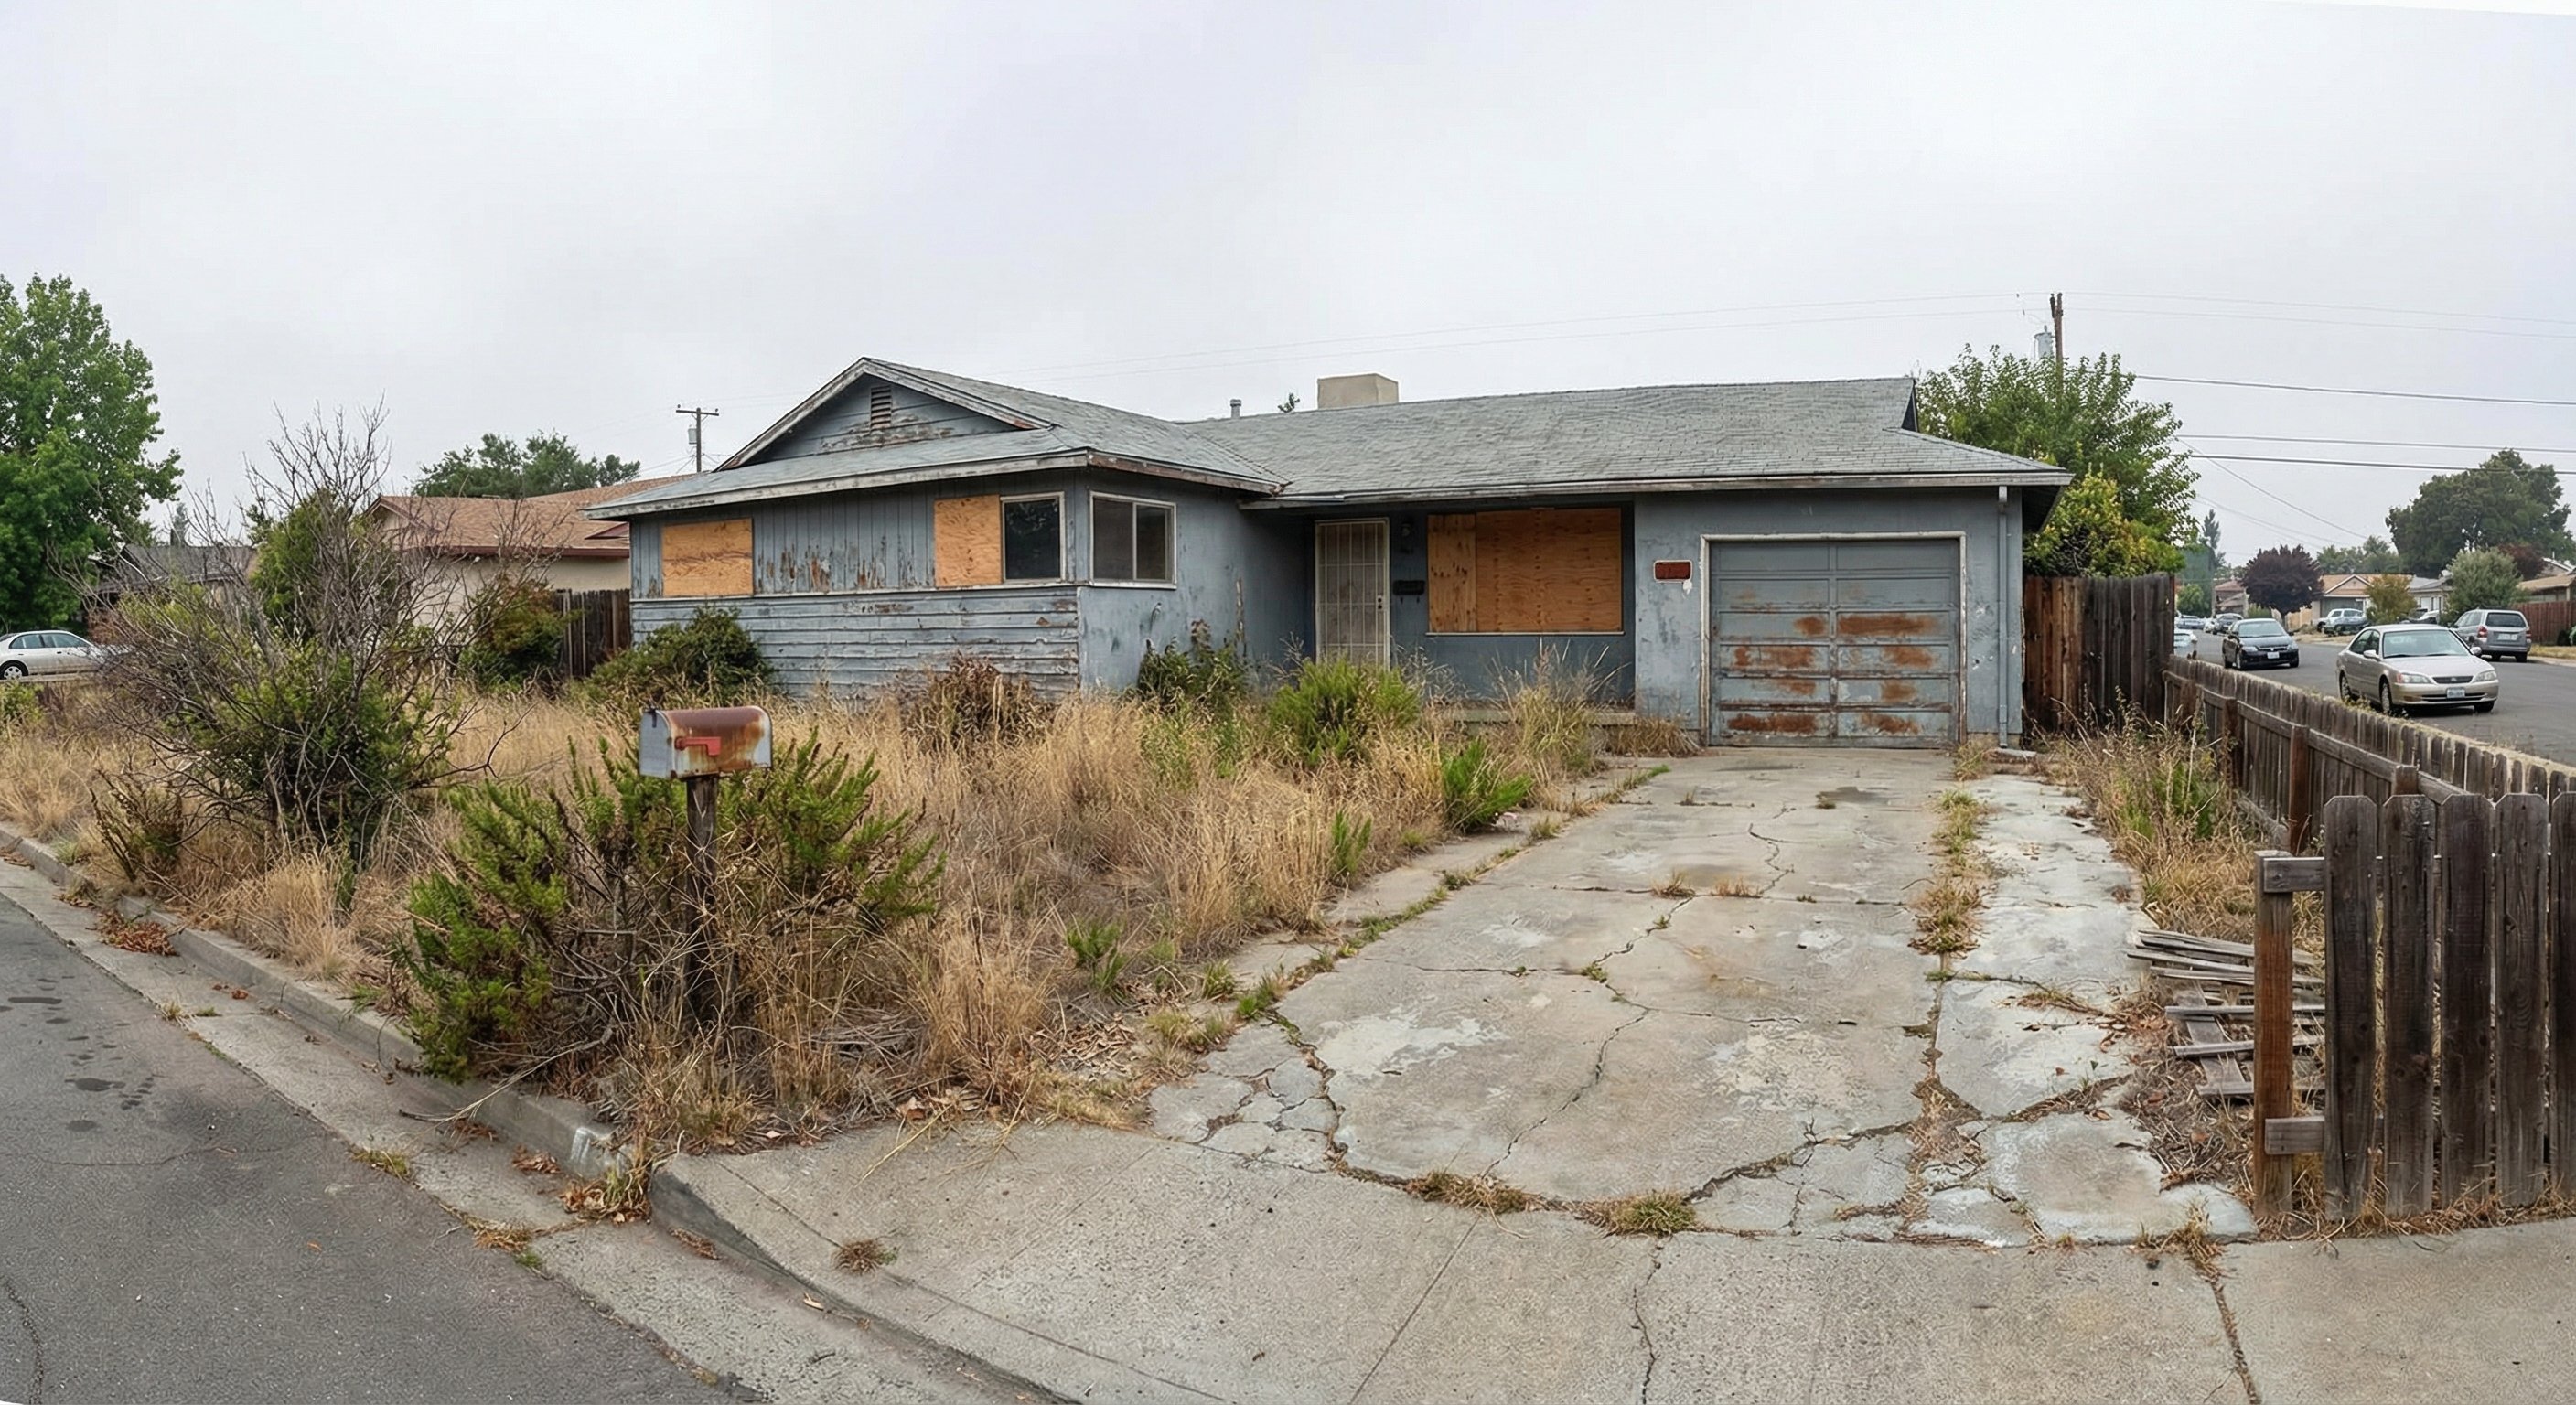
The best fix-and-flip candidates have cosmetic deferred maintenance and no major structural issues. A property with peeling paint, outdated bathrooms, and a 1980s kitchen is an ideal candidate. A property with foundation cracks, active water intrusion, or a compromised roof is a renovation nightmare dressed up as an opportunity.
Pre-foreclosure properties, tax-delinquent homes, probate estates, and vacant properties with code violations create purchase opportunities where motivated sellers accept prices below market value. The investor's job is identifying which distressed properties have cosmetic renovation potential versus structural remediation that blows the budget.
Location drives the ARV ceiling. A pre-foreclosure home in a stable neighborhood with cosmetic issues is a candidate. The same visual distress in a declining neighborhood near a troubled commercial zone is not.
Building an Accurate Renovation Budget
The industry standard in most US markets is $20 to $60 per square foot for cosmetic renovations covering paint, flooring, fixtures, and appliances. A 1,800-square-foot home runs $36,000 to $108,000 in renovation costs depending on scope.
The only accurate renovation budget comes from a detailed line-item scope of work written by a licensed contractor who has physically walked the property. Vague SOWs like "update bathrooms" produce bids that miss major cost categories.
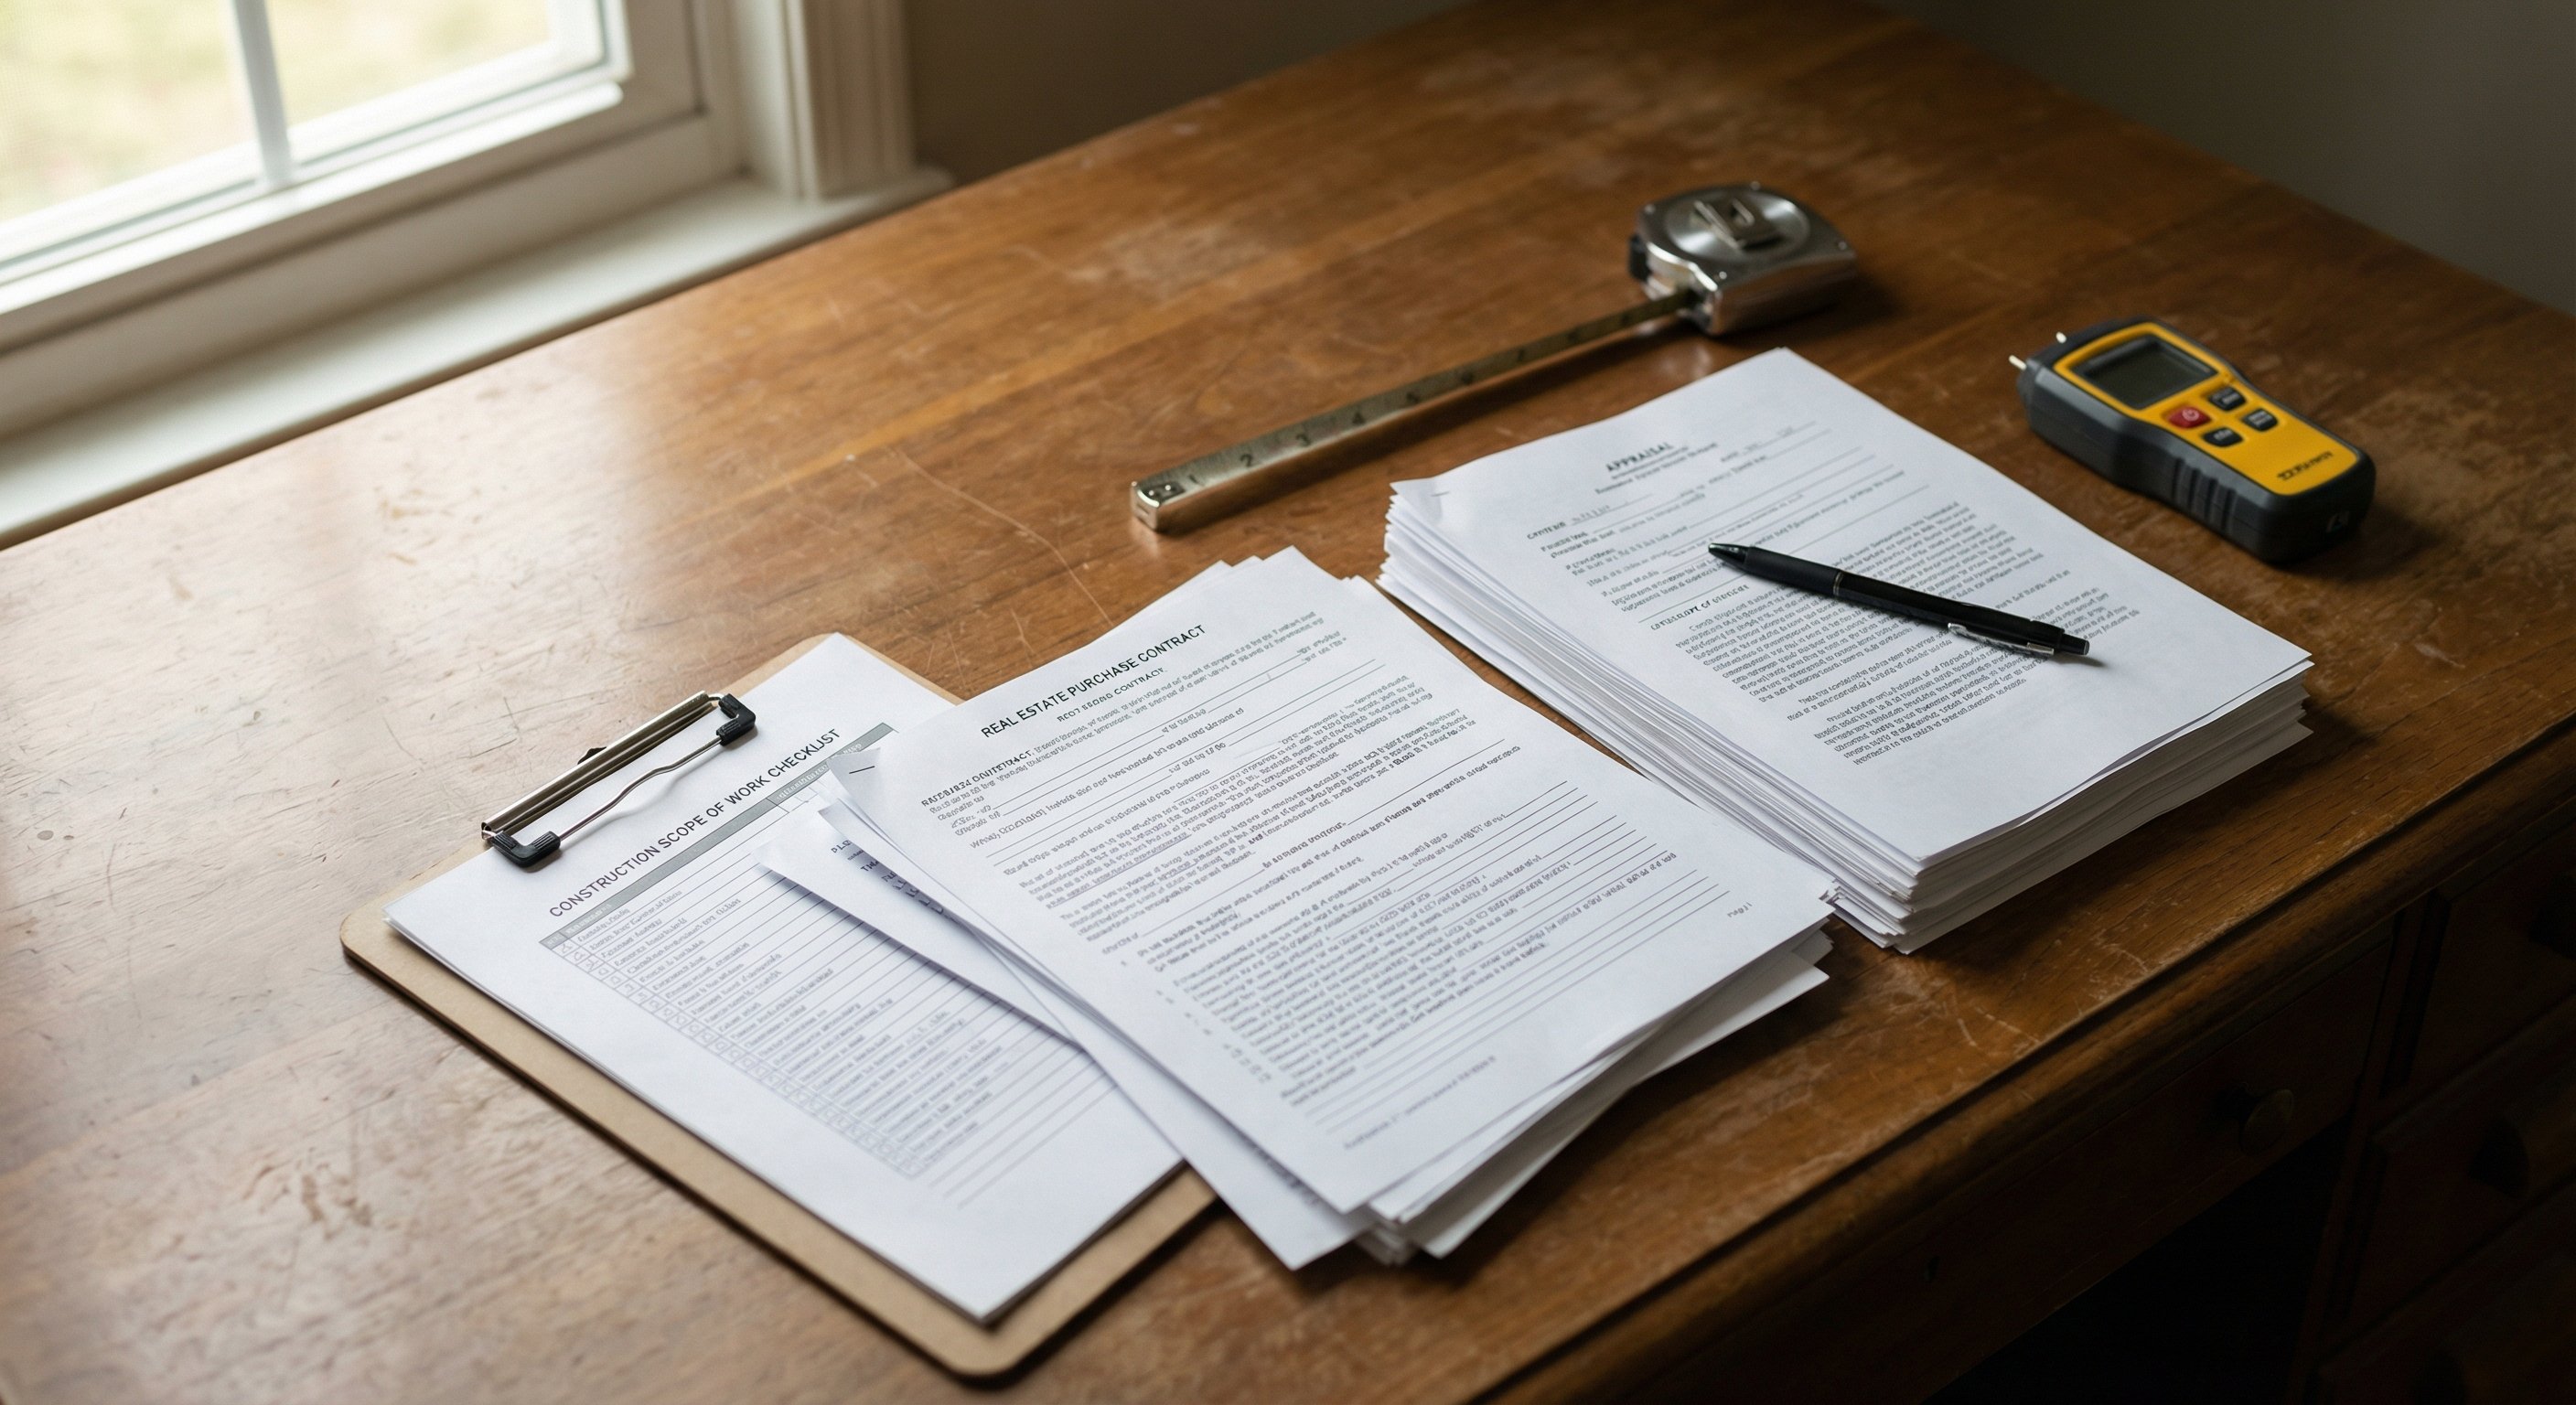
Investors who skip the contractor walk-through and rely on online cost estimators consistently underestimate by 15% to 30%. A $50,000 renovation estimate that arrives at $62,500 is the difference between a profitable flip and a break-even deal that consumed six months of capital for zero profit.
Three budget categories that consistently surprise first-time flippers: HVAC replacement ($8,000 to $15,000 if older than 15 years), electrical panel upgrades ($5,000 to $12,000 for properties older than 40 years), and asbestos or lead paint abatement ($1,500 to $8,000 for pre-1978 homes).
Free Weekly Alerts
See What's Distressed in Your Market
Get free weekly alerts — new distressed properties, motivation scores, and hot neighborhoods in your area. Addresses and contact info available inside DistressIQ.
Free forever · No credit card · Unsubscribe anytime
Assembling the Fix and Flip Team
The core team includes a licensed real estate agent or direct purchase contact, a dedicated contractor with at least five comparable renovations completed, a transaction coordinator, and a hard money lender pre-approved for renovation financing.
Hire a contractor who has personally completed multiple full-house renovations in the target neighborhood. Ask for references from the last five projects and call each one asking specifically about budget accuracy and timeline adherence.
Payment structure: draws tied to completed stages (30% at start, 30% at rough-in, 30% at trim and finish, 10% at final walkthrough). Never pay more than 35% upfront.

Hard money lenders who specialize in fix-and-flip financing typically lend at 70% to 75% of after-repair value. An investor buying at $135,000 with a $55,000 renovation budget and an ARV of $265,000 could potentially finance the full project through a hard money lender at 70% of ARV.
The Numbers That Actually Matter
The most useful metric is the spread between purchase price plus all-in costs and the final sale price minus costs of sale. All-in costs include purchase price, renovation spending, financing costs (interest, points, origination fees), holding costs (property taxes, insurance, HOA fees during renovation), and selling costs (agent commissions at 5% to 6%, transfer taxes, and closing costs at 1.5% to 2% of sale price).
A concrete example for a mid-market suburban flip:
- Purchase price: $135,000
- Renovation budget: $55,000
- Hard money interest and fees: $9,500
- Holding costs (7 months): $5,950
- Selling costs: $13,125
- Total cost basis: $218,575
- Sale price: $275,000
- Gross profit: $56,425
That $56,425 gross profit on roughly $190,000 in total capital deployed represents a gross return of roughly 30% over seven months. After income taxes, the net profit lands around $42,000.
The same deal with a $65,000 renovation budget and an eight-month timeline drops gross profit to roughly $36,000. Add a higher interest rate, and the net compresses further to a loss.
Timeline: The Silent Profit Killer
Every month a property sits unsold costs money in interest, insurance, taxes, and opportunity cost. A seven-month project at $850 per month in holding costs is manageable. A twelve-month project adds $4,250 in pure carrying costs.
The industry standard for a cosmetic full-house renovation is three to five months from purchase to listing. Renovation delays typically fall into three categories: scope changes requested by the investor, contractor scheduling conflicts for specialized trades, and hidden conditions discovered during demolition. Investors control scope changes and can push back on timelines with signed contracts that include completion dates and liquidated damages clauses.
The decision rule: if a project will exceed six months from purchase to sale, recalculate the holding cost math. A property that sits on market for 60 to 90 days needs a price adjustment rather than waiting for an offer at an unrealistic number.
Alternative Exit Strategies
Not every fix-and-flip property needs to sell to a traditional retail buyer. Alternative exits include cash sale to an institutional buyer (iBuyer platforms buy at 85% to 92% of market value for certainty and speed), wholesale to another investor (preserves capital for the next deal), and lease options or seller financing (converts a flip into a cash-flowing asset in tight financing markets).
Frequently Asked Questions
Q: How much capital do you need to start fix and flip real estate?
With hard money financing covering 70% to 75% of purchase price plus renovation costs, an investor needs 25% to 30% of total project cost in cash. For a $190,000 total project, the cash requirement is roughly $50,000 to $60,000 including closing costs and a 10% to 15% renovation contingency reserve.
Q: What is the average profit margin on a fix-and-flip deal?
Industry surveys show average gross profit on a successful fix-and-flip ranges between $30,000 and $70,000 depending on market and scope. Gross margin typically lands at 20% to 35% on well-executed deals. Net profit after financing costs, holding costs, and taxes usually runs $25,000 to $50,000 per project.
Q: How do you calculate ARV for a fix-and-flip property?
ARV is calculated by finding the most recent sales prices of comparable properties within the subject property's specific neighborhood. Comps should match the renovated target in bedroom count, bathroom count, square footage (within 15%), lot size, and construction style. Use sales from the past 90 days only. County assessor records provide accurate square footage and lot size data that help verify comp accuracy.
Q: What renovations have the highest ROI in fix-and-flip deals?
Kitchen renovations consistently deliver the highest ROI. A minor kitchen remodel ($25,000 to $40,000) typically adds $20,000 to $35,000 in value. Bathroom updates rank second: a full renovation at $20,000 to $30,000 adds $15,000 to $25,000 in value. Curb appeal improvements including exterior paint, landscaping, and front door replacement deliver $3,000 to $7,000 in spending that adds $8,000 to $15,000 in perceived value.
Q: What are the biggest mistakes new fix-and-flip investors make?
Overpaying at acquisition is the most common and most damaging mistake. Buying at 90% of ARV instead of 70% leaves no margin for overages and timeline extensions. Underestimating renovation costs driven by skipping the detailed scope-of-work walk-through with a licensed contractor is the second most common mistake. Taking on too many projects simultaneously is the third, which stretches capital and management attention to the point where no single project receives the oversight it needs.
Q: How long does a typical fix-and-flip project take from purchase to sale?
A well-managed fix-and-flip project takes four to seven months from purchase to sale. Renovation typically runs three to five months for a full-house cosmetic renovation. Listing and closing takes an additional 30 to 60 days for a retail buyer with financing, or 7 to 14 days for a cash sale. Major structural renovations extend timelines to six to nine months.
Q: Should you use hard money or conventional financing for fix-and-flip deals?
Hard money lenders specialize in short-term renovation financing and can close in 7 to 14 days, essential when buying distressed properties at auction or in short-sale situations where conventional financing timelines disqualify the investor. Hard money rates run higher (12% to 18% APR versus 7% to 9%), but the short duration of a fix-and-flip project keeps total interest cost manageable. The speed advantage often makes the difference between winning and losing a deal in competitive distressed property markets.
The DistressIQ platform tracks distressed property signals across every US county, helping fix-and-flip investors identify properties with cosmetic renovation potential before they hit the broader market. Properties with pre-foreclosure filings, code violations, or tax delinquency often trade at prices below their renovation-upgraded value, creating the purchase price discipline that makes fix-and-flip profits possible. Browse distressed properties scored by motivation on DistressIQ.
The investors who consistently profit from fix-and-flip deals share one trait above all others: purchase price discipline. They walk away from deals that do not meet their acquisition criteria even when those deals seem attractive in the moment. That discipline, combined with accurate renovation budgeting and a reliable execution team, makes fix-and-flip real estate one of the most reliable wealth-building strategies available to active investors.
The data behind this article
DistressIQ Monitors These Signals in Real Time
Pre-Foreclosures
NOD + NTS filings
Tax Delinquency
County treasurer records
Code Violations
Municipal inspection filings
Probate Filings
Superior Court records
Every lead is scored 0–100 for seller motivation based on signal type, duration, severity, and stacking. Nationwide coverage — every US county, updated daily.
Ready to find deals in your market?
See Live Distress Signals in Your County
Stop calling dead leads. Every lead in DistressIQ is scored 0–100 for seller motivation, with verified contact info included. Browse the free tier to see what's active in your market right now.
Browse Free Leads — No Credit Card