Real Estate Investing Strategies: How to Pick the Right One for Your Market in 2026

TL;DR: Real estate investing strategies depend entirely on what distressed property inventory actually exists in your target market. Most investors choose a strategy first and hunt for deals. The inversion approach starts with distressed property signal data. Pre-foreclosure filings favor fix-and-flip and wholesale deals. Tax delinquent inventory enables deep-discount buy-and-hold entry. Probate and code violations create motivated sellers across all strategy types. Data determines which strategy will work in a given county. Source the deals before competitors do, and the strategy takes care of itself.
Most Investors Get This Backwards
There is a standard playbook for choosing a real estate investing strategy. It goes like this: decide whether to wholesaling, fix and flip, or buy and hold. Learn the mechanics. Raise capital or line up financing. Then start looking for deals.
That playbook is fine for learning. It is a terrible operating method.
The problem is that the strategy you choose has to match the inventory available in your target market. A fix-and-flip investor operating in a county where pre-foreclosure filings have dropped 60 percent since 2020 is fighting for scraps. A buy-and-hold investor in a market with no tax delinquent properties and high entry prices is paying full retail for rental income that will never pencil out.
The investors who consistently source off-market deals before the market knows they exist are the ones who look at distressed property signals first and strategy second. They let the data tell them what kind of deal flow actually exists. Then they run the strategy that matches the inventory.
This is not a subtle distinction. It changes everything about capital allocation, team structure, holding costs, and exit timing. Here is how it works in practice.

What the Main Strategies Actually Return
Before getting into how to source deals, it helps to be clear about what each strategy actually returns in 2026. The numbers have shifted.
Buy and Hold Rental Income
Buy and hold remains the foundation of long-term wealth building in real estate. The mechanism is straightforward: purchase a property, rent it out, collect monthly cash flow, and hold for appreciation and mortgage paydown.
The numbers in 2026 are more compressed than 2021. Median home prices in most major metros remain elevated despite rising interest rates. Gross rental yields in the 4 to 7 percent range are achievable in secondary markets (Indianapolis, Memphis, Cleveland, Kansas City) where entry prices allow. Coastal markets often show gross yields below 3 percent, which rarely covers mortgage, taxes, insurance, and vacancy reserves.
Net cash-on-cash returns for buy and hold in 2026 typically range from 4 to 8 percent annually in workable markets after expenses, according to Primior Group's 2026 market analysis. The long-term upside comes from mortgage paydown and appreciation, which historically adds another 3 to 5 percent per year on a smoothed basis. The strategy works best for investors with long time horizons and properties acquired at a sufficient discount to support refinancing.
Fix and Flip
Fix and flip generates a lump-sum profit rather than recurring cash flow. The investor purchases a distressed property below market value, funds renovations, and sells at the after repair value. According to the 2026 HonestCasa Fix and Flip Guide, target profit per deal ranges from $30,000 to $100,000 depending on market and property condition, with gross profit after renovation costs, carrying costs, and taxes landing in the $25,000 to $65,000 range for most operators in 2026.
The 70 percent rule remains the standard guideline for entry pricing. Maximum purchase price equals ARV times 0.70, minus renovation costs. In 2026, renovation costs have stabilized at elevated levels — a mid-range kitchen and bath remodel in a secondary market runs $35,000 to $60,000. Carrying costs (interest, insurance, taxes) add another $2,000 to $4,000 per month in most markets.
Average gross profit per flip nationally runs in the $25,000 to $65,000 range, according to industry data from 2025 and early 2026 reports. After renovation overruns, holding costs, and selling costs (agent fees, transfer taxes), net profit typically lands between $15,000 and $40,000 per deal in workable markets. That assumes the investor is buying at the right price — which is the part most beginners miss.
Flip margins have compressed since the 2021 peak. In 2026, the investors making consistent money are buying at deep enough discounts to weather unexpected costs and market softness at resale.
Wholesaling
Wholesaling is the lowest-capital entry point to real estate investing. The wholesaler finds a motivated seller, puts the property under contract at a discount, and assigns that contract to an end buyer (another investor or end occupant) for an assignment fee.
The assignment fee is the revenue event. Typical assignment fees range from $5,000 to $25,000 per deal, depending on the spread between contract price and market value. The wholesaler does not close on the property — the end buyer does.
The critical difference from a business standpoint is that wholesaling revenue is transaction-based and highly dependent on deal flow volume. A wholesaler who sources 2 deals per month at $10,000 average fee generates $240,000 annually. Volume is the engine.
The Distress Signal Framework: How Data Determines Which Strategy Works
Here is where most educational content stops. It gives you the three strategies and tells you to pick one. The inversion approach starts with the inventory.
Distress signals are the public-record indicators that a property owner is under financial or legal pressure. They include pre-foreclosure filings (notice of default), tax delinquency records, code violation notices, lis pendens filings, and probate case openings. Each signal type correlates with specific seller motivations and specific deal structures.
Pre-Foreclosure Signals
Pre-foreclosure filings appear when a borrower has missed mortgage payments and the lender has initiated the default process. This signal typically surfaces 60 to 180 days before a scheduled foreclosure auction, depending on the state.
Pre-foreclosure leads are the highest-value sourcing opportunity for fix-and-flip investors and buy-and-hold investors targeting equity sales. The seller has a deadline problem. The urgency is concrete and time-limited. Motivation is typically high.
In judicial foreclosure states (Florida, Illinois, New York, New Jersey), pre-foreclosure timelines run longer — often 180 to 360 days from filing to auction. That extended window means more time to negotiate directly with the homeowner before the auction, which is where wholesalers and agents targeting off-market deals have an advantage.
In non-judicial states (California, Texas, Georgia, Arizona), the timeline from notice of default to auction can be as short as 90 days. Speed matters. Investors who have pre-foreclosure signal coverage in non-judicial states need to move fast or lose the deal to a competitor who already has a relationship with the homeowner.
Tax Delinquent Properties
When property owners fail to pay property taxes, the county places a lien on the property. In most states, investors can purchase these liens at auction or directly from the county after a redemption period expires.
Tax delinquent properties represent one of the deepest-discount sourcing channels available. Counties in Ohio, Florida, and Texas regularly see tax lien sales where distressed properties trade at 20 to 40 percent of estimated market value. The discount reflects the as-is condition, tax debt load, and possession complications — not the true value of the real estate.
For buy-and-hold investors, tax delinquent acquisitions in markets with strong rental demand (Cleveland, Memphis, St. Louis) can pencil out at entry prices that support 8 to 12 percent gross yields. For fix-and-flip investors, tax delinquent properties often need significant rehabilitation, so renovation budgets must be factored into the 70 percent rule calculation.
In Florida's Miami-Dade County, the median time from tax certificate sale to tax deed auction runs approximately 22 months. In Cuyahoga County, Ohio, the timeline is closer to 14 months. These are not interchangeable markets. A buy-and-hold investor targeting Ohio's tax sale cycle needs less capital reserves than one targeting Florida's longer redemption window.
Code Violation and Vacant Property Signals
Properties with active code violation notices are often owned by absentee landlords or owners who have lost the ability to maintain the property. A code violation filed by a city inspector signals that the property has been inspected and found in violation of habitability or maintenance standards.
Vacant property signals overlap significantly with code violation data. A property that is both vacant and flagged for code violations is often a candidate for a quick cash offer from an investor willing to handle the city compliance process.
These signal combinations are particularly valuable for wholesaling. The owner is already under financial or logistical pressure. The property is not performing. A clean cash offer solves their problem quickly, which makes them highly motivated to assign the contract.
Probate and Divorce Filings
Probate filings indicate a property is in the process of estate settlement. When a property owner dies, the estate typically must liquidate assets, including real estate, to settle debts and distribute inheritance. Probate properties frequently trade at a discount because heirs want a fast, clean transaction rather than managing a rental.
Divorce-related property sales arise when marital settlement agreements require the sale of jointly owned real estate. These are highly motivated sellers — the timeline is often court-ordered, and both parties want resolution.
Both probate and divorce signals tend to produce clean transactions with motivated sellers who do not want to manage property anymore. For buy-and-hold investors, probate acquisitions in the right markets can be an excellent source of below-market entry points for long-term rental portfolios.

Free Weekly Alerts
See What's Distressed in Your Market
Get free weekly alerts — new distressed properties, motivation scores, and hot neighborhoods in your area. Addresses and contact info available inside DistressIQ.
Free forever · No credit card · Unsubscribe anytime
Matching Signal Availability to Strategy
The practical question is straightforward: what distressed signal types are most prevalent in the market where you want to operate?
If a county shows high volumes of tax delinquent properties — particularly in markets with a history of tax lien sales — buy-and-hold and wholesale entry points are strong. The acquisition cost basis is low enough that both strategies can work, and the motivated sellers are dealing with financial pressure that creates real negotiating room.
If pre-foreclosure filings are rising in a county, fix-and-flip activity is likely active in that market. Pre-foreclosure sellers have short windows before auction and are often working with lenders who prefer a short sale or cash offer over going to auction. This is where wholesalers and fix-and-flip investors who have established relationships with distressed homeowners can move faster than the market.
If both signals are sparse in a target county, the inventory environment is competitive. Investors in those markets typically pay closer to retail pricing, which compresses margins across all strategies. The inversion investing framework still applies — it tells you to either find a different county or adjust expectations for lower-margin, higher-volume approaches.
How to Source Distressed Properties Systematically
Finding off-market distressed properties before competitors requires systematic data access. Public records are the source. County assessor databases, court filing systems, and recorder documents all contain the signals described above.
The practical challenge is that these records are distributed across thousands of county systems with no unified format. A county recorder's online search interface in Cook County, Illinois looks nothing like the database in Maricopa County, Arizona. Navigating them manually takes hours per county per signal type.
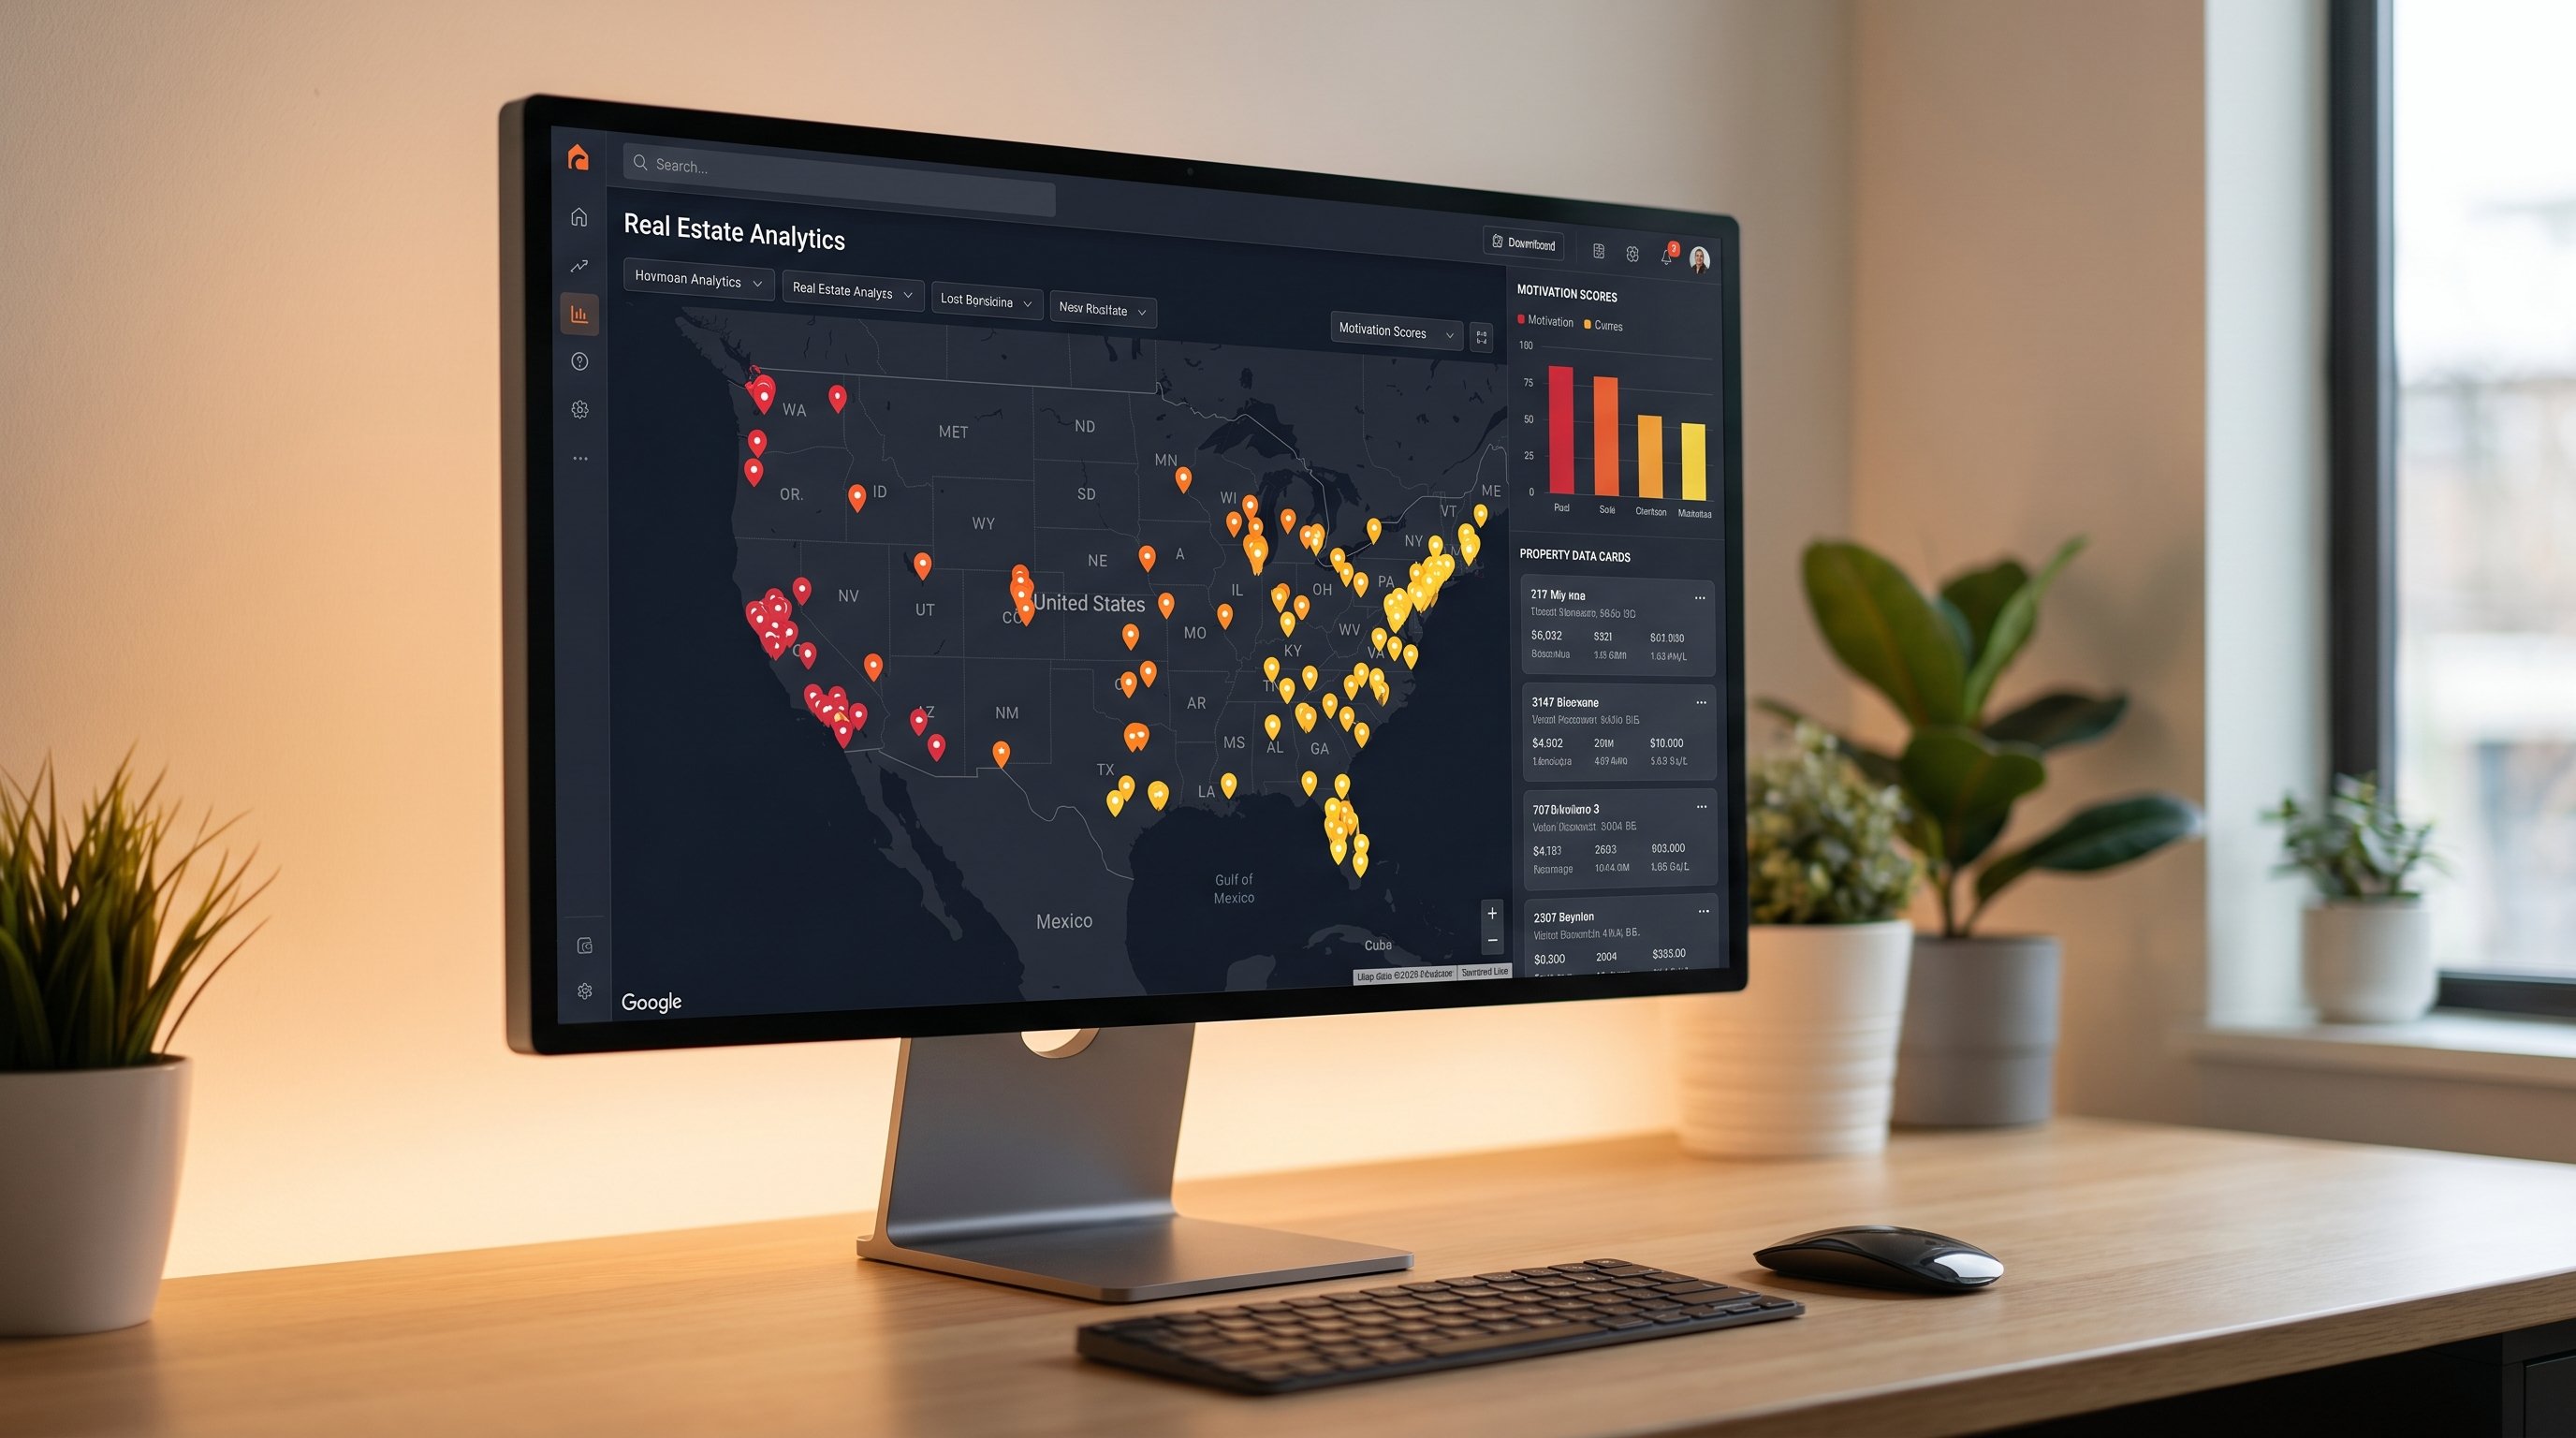
DistressIQ aggregates distressed property signals across more than 3,200 US counties, pulling from county assessor records, court filings, and recorder documents. Every property in the platform has at least one verified distress signal. Leads are sorted by a motivation score that stacks multiple signals per property, so investors can prioritize the most motivated sellers first rather than working through a flat list.
For investors running multiple strategies simultaneously, the signal stacking approach is particularly useful. A property flagged for both pre-foreclosure and tax delinquency might be a fix-and-flip candidate. A property with a code violation and an absentee owner might be a wholesale opportunity. The motivation score surfaces the highest-probability deals regardless of which strategy the investor is running.
Quick Strategy Comparison
| Factor | Buy and Hold | Fix and Flip | Wholesaling |
|---|---|---|---|
| Capital required | $30,000–80,000+ | $50,000–120,000+ | $5,000–15,000 |
| Time to profit | 6–18 months to positive cash flow | 4–9 months per deal | 30–90 days per deal |
| Revenue type | Monthly cash flow + equity buildup | One-time lump sum | Assignment fee per transaction |
| Best signal match | Tax delinquent, probate | Pre-foreclosure, code violation | Pre-foreclosure, code violation, absentee owner |
| Active involvement | Moderate (tenant management) | High (project management) | Moderate (sourcing and negotiation) |
| Risk profile | Lower per-deal risk, long holding period | Higher per-deal risk, short cycle | Low capital risk, high volume dependence |
| 2026 margin outlook | 4–8% net CoC in workable markets | $15,000–$40,000 net per deal | $5,000–$25,000 assignment fee per deal |
Key Takeaways
Invert the decision order. Most investors choose a strategy first and source deals second. The inversion approach uses distressed property signal availability to determine which strategy will actually work in a specific market.
Tax delinquent inventory is the deepest-discount sourcing channel. In markets with active tax lien sales (Ohio, Florida, Texas counties), buy-and-hold and wholesale entry points at 20 to 40 percent of market value are achievable. These are not common in every county — check the signal data first.
Pre-foreclosure windows vary dramatically by state. Judicial foreclosure states (Illinois, New York, New Jersey, Florida) extend the pre-foreclosure negotiation window to 6 to 12 months. Non-judicial states (California, Texas, Georgia) compress it to 90 days or less. Speed of sourcing infrastructure matters more in non-judicial states.
Fix and flip margins are narrower in 2026 than 2021. Gross profit per deal has compressed. The investors consistently profitable are buying at sufficient discounts to absorb renovation overruns, carrying costs, and resale market softness.
Wholesaling is volume-dependent. The assignment fee model only works at scale. Investors who systematize their lead generation and build relationships with end buyers can generate consistent transaction volume that compounds over time.
The DistressIQ platform tracks pre-foreclosure, tax delinquent, code violation, probate, and vacancy signals across every US county, updated daily from county assessor and court records. Investors can browse distressed property leads free, filter by signal type, and sort by motivation score to prioritize the most actionable opportunities.
See distressed property signals in your target market — browse free on DistressIQ.
Frequently Asked Questions
Q: What is the safest real estate investing strategy for beginners with limited capital?
Buy and hold rental property is generally considered the lowest-risk entry point for beginners because it does not require the same capital reserves or active project management as fix and flip. The investor purchases a property, rents it out, and the tenant's rent covers the mortgage, taxes, insurance, and maintenance over time. Capital requirements vary significantly by market — secondary markets like Kansas City, Memphis, and Indianapolis have median home prices of $180,000 to $250,000, which allows a conventional investor to enter with $30,000 to $60,000 total (down payment, closing costs, and reserves). Coastal markets require significantly more capital and typically show lower cash-on-cash returns. Beginners should start in markets where they can buy at a price that supports positive cash flow after all expenses.
Q: How do I know which real estate investing strategy fits my local market?
The answer comes from analyzing distressed property signal data, not from choosing a strategy first. Pull pre-foreclosure filing counts and tax delinquency rates for your target county from county court and assessor records. If tax delinquent properties are trading at county tax sales at 25 to 40 percent of market value, buy-and-hold and wholesale entry points are strong. If pre-foreclosure filings are rising but tax sale inventory is thin, fix and flip and short-sale negotiations are the more viable channels. If both signals show low volume, the market is competitive and pricing will be closer to retail — which compresses margins for all three strategies. The data tells you what is available. You decide which strategy matches the available inventory and your capital situation.
Q: Can I run more than one real estate investing strategy at the same time?
Yes, many experienced investors operate multiple strategies simultaneously. A typical combination is a long-term buy-and-hold rental portfolio supplemented by fix-and-flip deals or wholesaling assignments. The key operational difference is capital allocation and timeline. Rental properties tie up capital for years but generate monthly cash flow. Fix-and-flip deals free up capital within 4 to 9 months but require active project management and have higher per-deal risk. Wholesaling is the most capital-light and can run alongside either of the others. The constraint is not strategy compatibility — it is attention and capital bandwidth. Most investors find it more profitable to master one strategy first and add a second only after the first is systematized.
Q: What capital do I need to start wholesaling real estate?
Wholesaling requires significantly less capital than buying property outright, but it is not free. The primary costs are marketing to find motivated sellers (direct mail, cold calling, bandit signs, online advertising) and potentially a small earnest money deposit when you put a property under contract. Marketing budgets for a functioning wholesale operation typically start at $1,500 to $3,000 per month for a part-time operator. Some markets require an earnest money deposit of $500 to $2,500 per deal to demonstrate seriousness to the seller. Total startup capital for a basic wholesaling operation ranges from $5,000 to $15,000, with the majority going to marketing. The revenue per deal (assignment fee) ranges from $5,000 to $25,000, so a single successful assignment often covers multiple months of marketing costs.
Q: How do distressed property signals improve deal quality compared to cold marketing?
Cold marketing — postcards to a random list of homeowners, cold calling from purchased lead lists — reaches a lot of people who are not actually motivated to sell. Skip tracing those lists and making contact is time-consuming and expensive. The conversion rate on cold marketing typically runs between 0.5 and 2 percent for serious seller conversations. Distressed property signals point to homeowners who already have a documented reason to sell: a foreclosure deadline, unpaid property taxes, an active code violation, or a probate filing. These are not random homeowners who might consider selling — they are homeowners who need to sell. The conversion rate on pre-foreclosure and tax delinquent leads is materially higher because the motivation already exists. The investor's job shifts from generating motivation to getting in front of motivated sellers before competitors do.
Q: What is the 70 percent rule in fix and flip, and how has it held up in 2026?
The 70 percent rule is a quick entry-pricing formula for fix-and-flip investors. Maximum allowable offer equals the after repair value (ARV) multiplied by 0.70, minus estimated renovation costs. The formula protects the investor's profit margin by ensuring enough cushion to cover carrying costs, selling costs, and renovation overruns. In 2026, some experienced flippers in strong markets are using the 65 percent rule to build in additional margin, given compressed sale prices in some metro areas and persistent renovation cost inflation. The 70 percent rule is a starting point, not a guarantee. Actual net profit per deal depends on accurate ARV estimates, accurate renovation budgets, and realistic holding timelines. The investors who lose money on flips are usually buying at 75 to 80 percent of ARV, leaving no room for the unexpected.
Q: How do I find off-market distressed properties without driving for dollars?
Driving for dollars — physically driving neighborhoods looking for distressed properties — is effective but time-intensive and geographically limited. Off-market distressed properties can be found systematically through public records analysis using county assessor and court filing databases. Pre-foreclosure filings, tax delinquency records, code violation notices, and probate case openings are all public information in most states. The challenge is that each county maintains these records differently, and checking them manually across multiple counties requires significant time. Platforms that aggregate distressed property signals from county records allow investors to search by signal type, property characteristics, and geographic area without navigating county websites individually. This approach is particularly valuable for investors targeting multiple counties or out-of-state markets where driving for dollars is not practical.
The data behind this article
DistressIQ Monitors These Signals in Real Time
Pre-Foreclosures
NOD + NTS filings
Tax Delinquency
County treasurer records
Code Violations
Municipal inspection filings
Probate Filings
Superior Court records
Every lead is scored 0–100 for seller motivation based on signal type, duration, severity, and stacking. Nationwide coverage — every US county, updated daily.
Ready to find deals in your market?
See Live Distress Signals in Your County
Stop calling dead leads. Every lead in DistressIQ is scored 0–100 for seller motivation, with verified contact info included. Browse the free tier to see what's active in your market right now.
Browse Free Leads — No Credit Card