After Repair Value (ARV): The Number Every Real Estate Investor Must Master
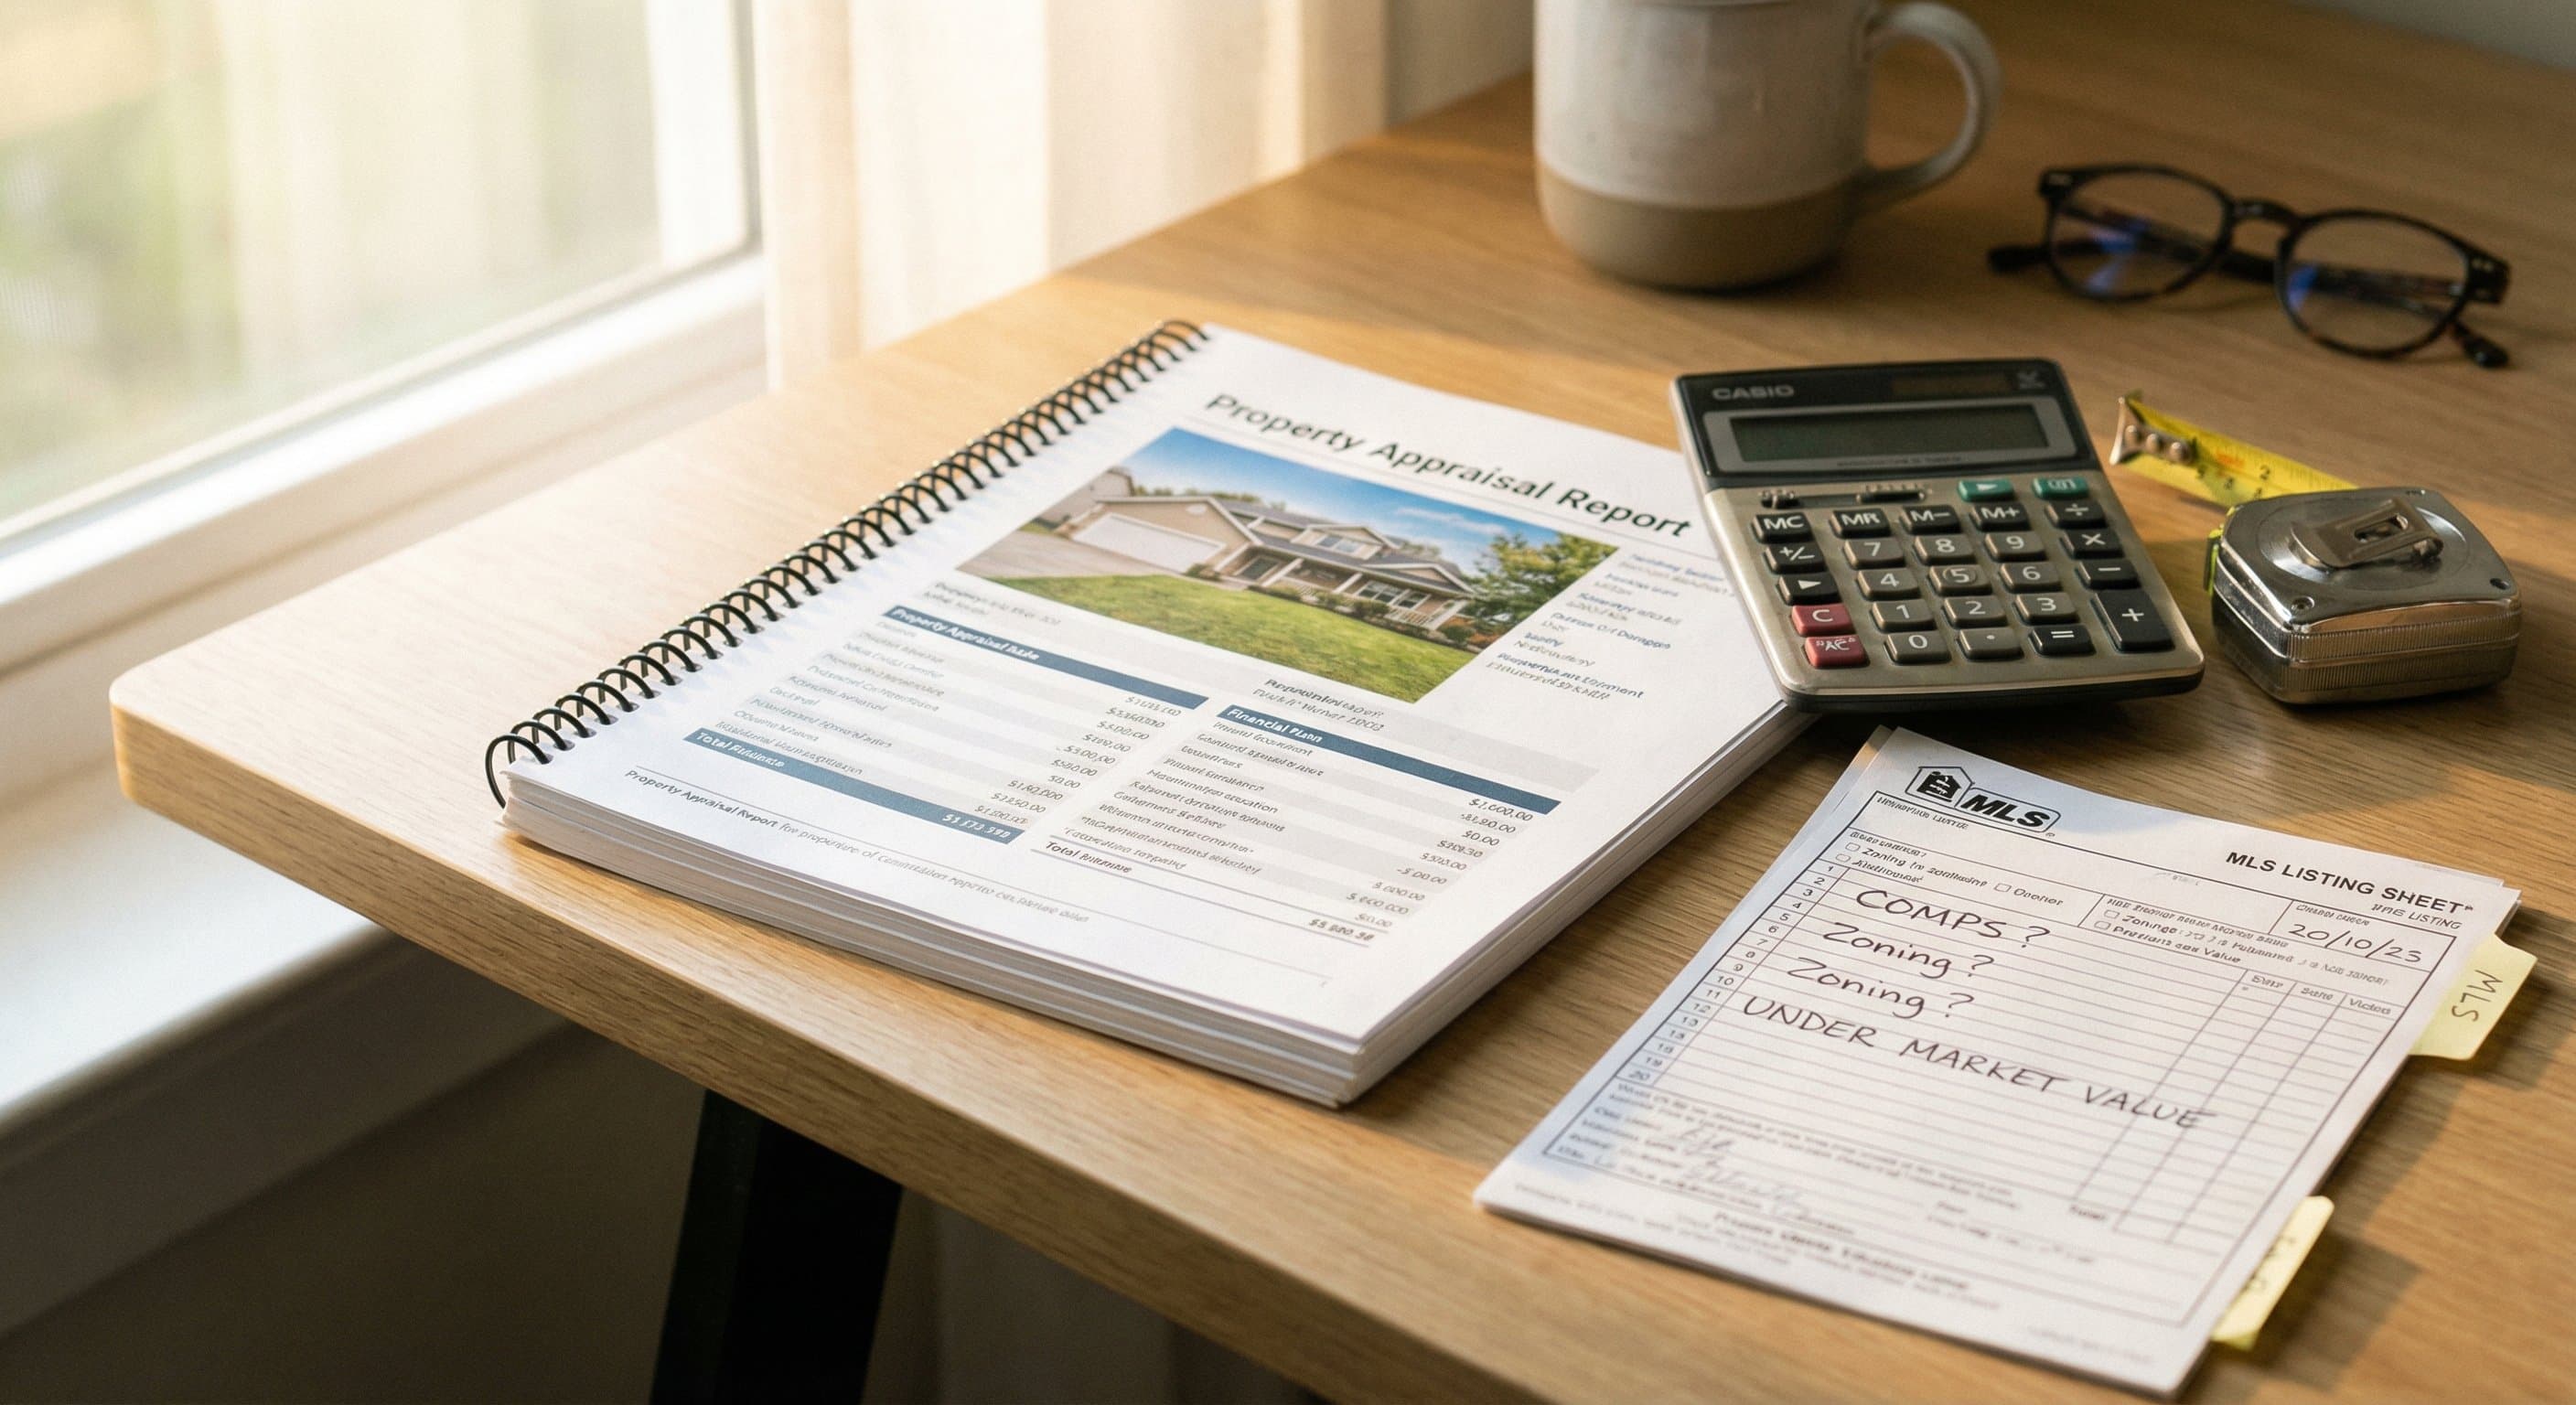
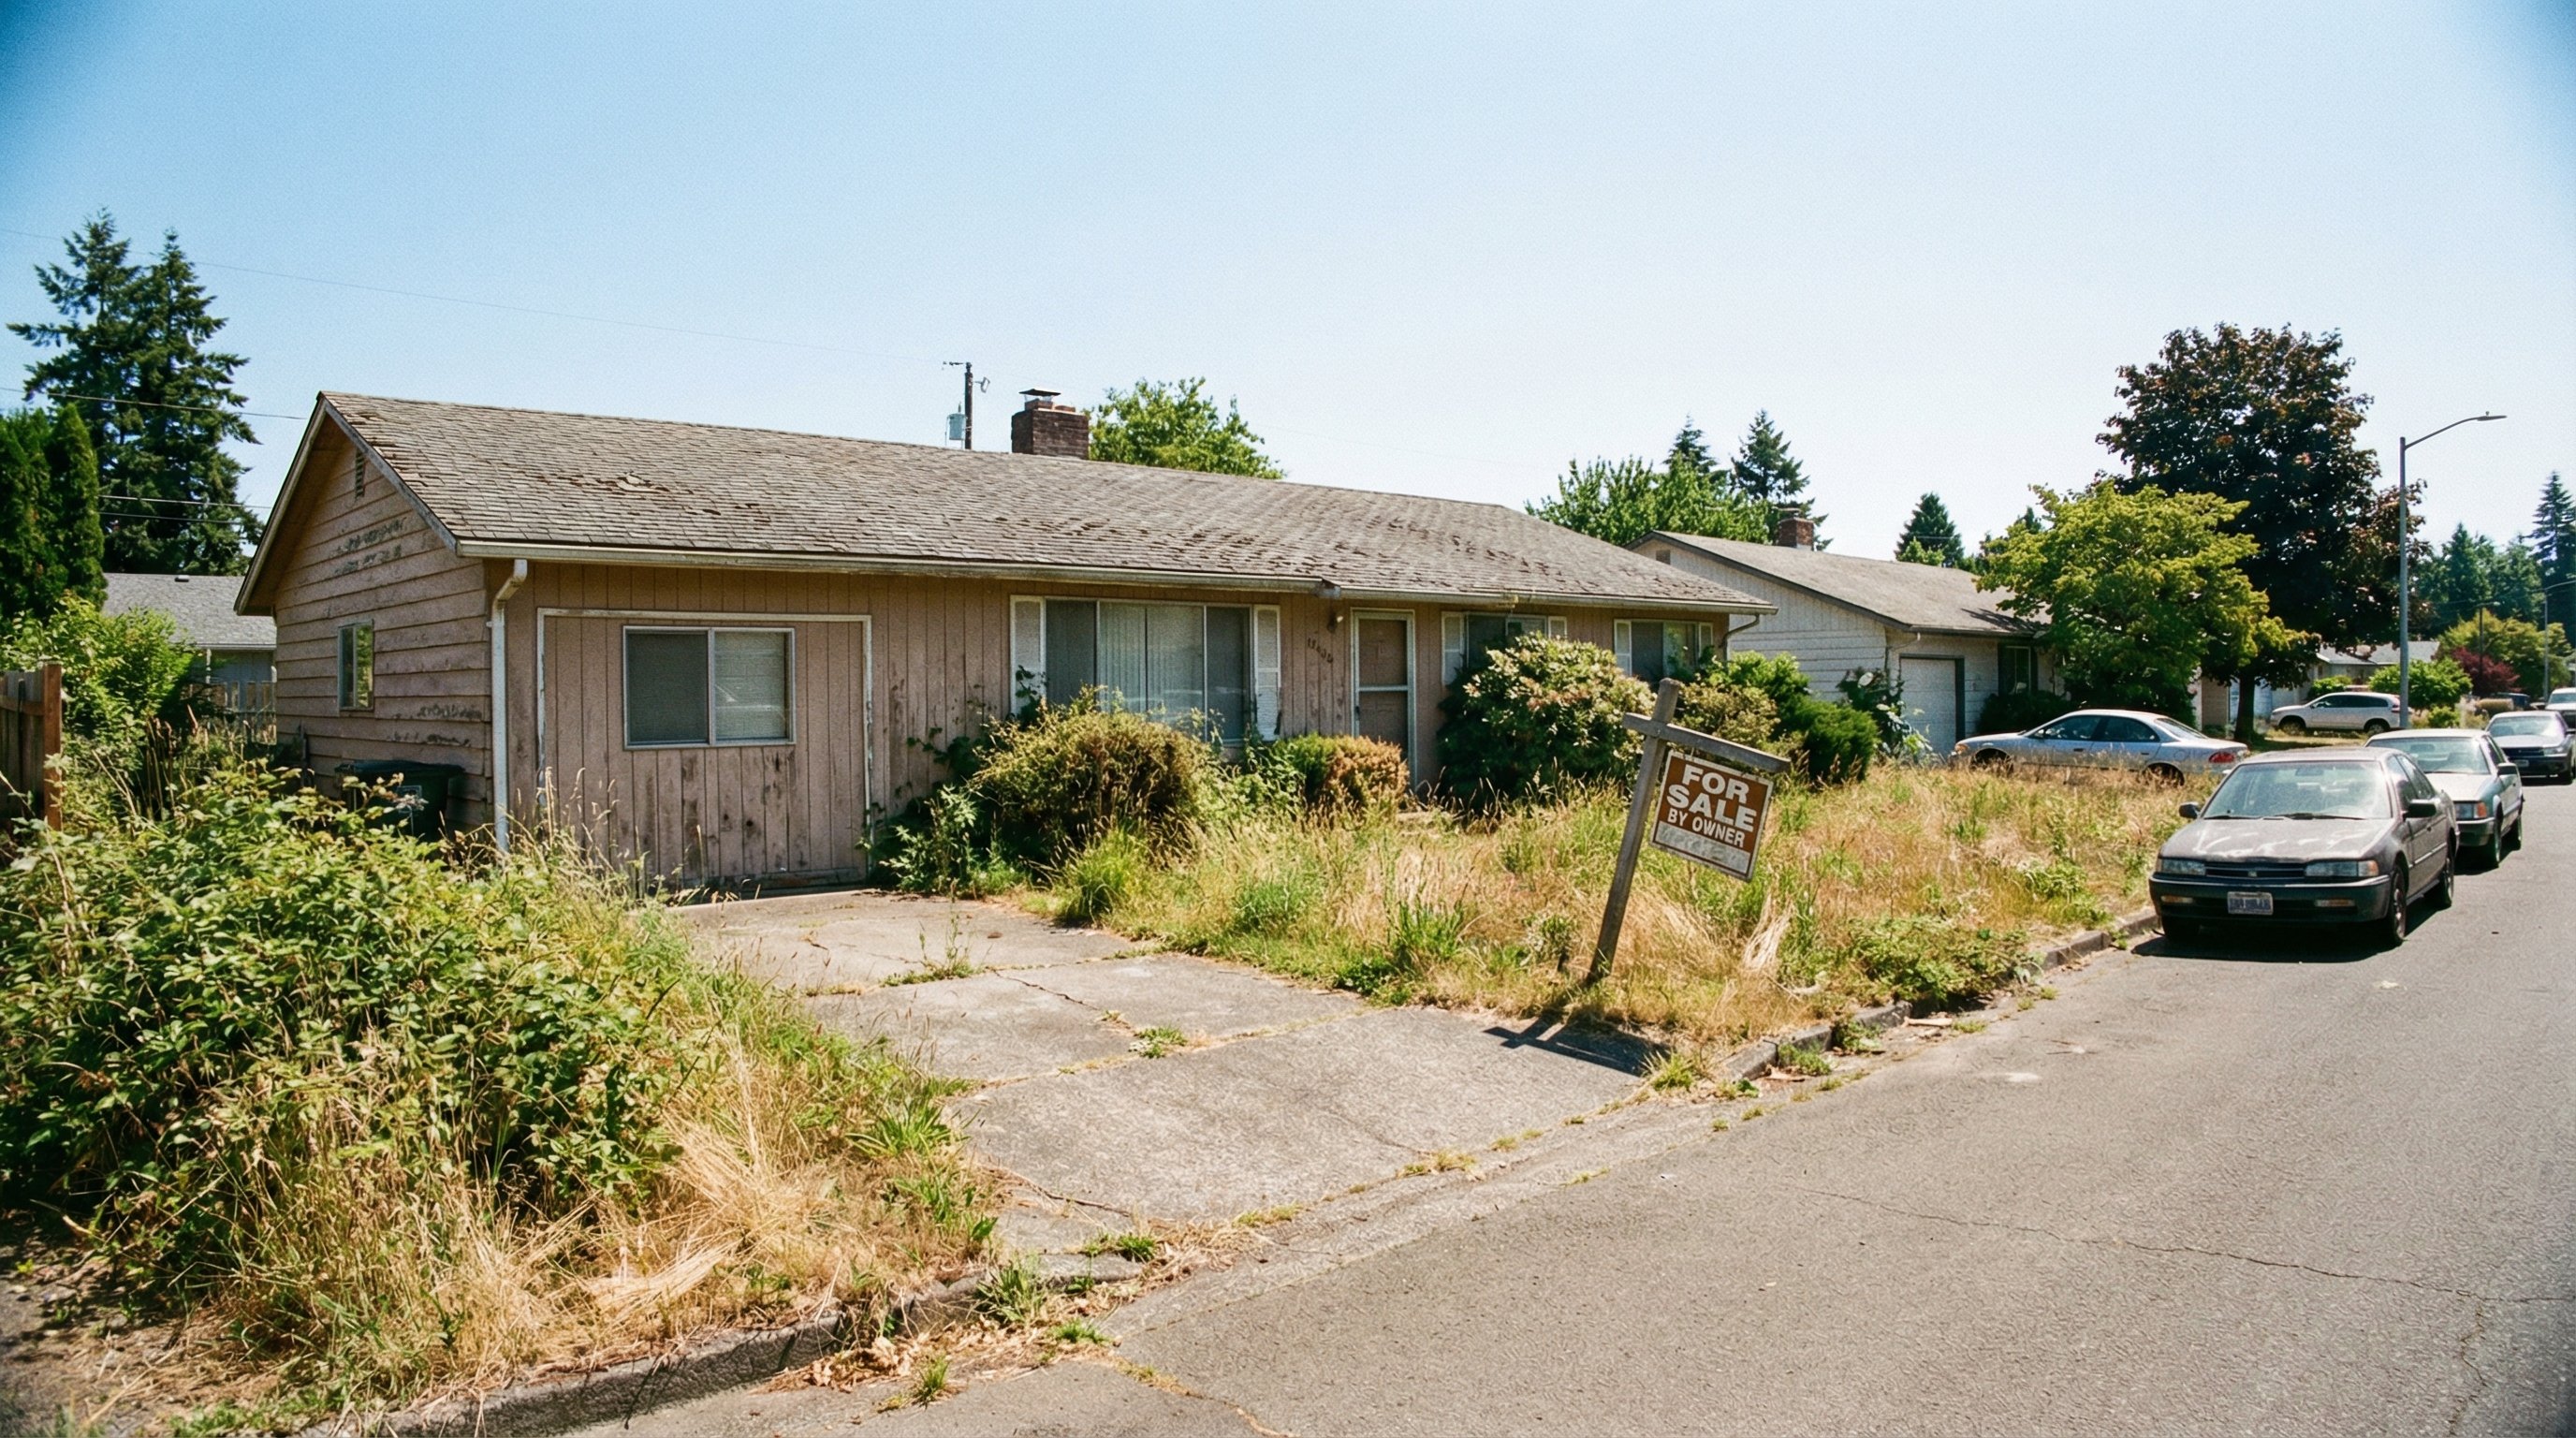
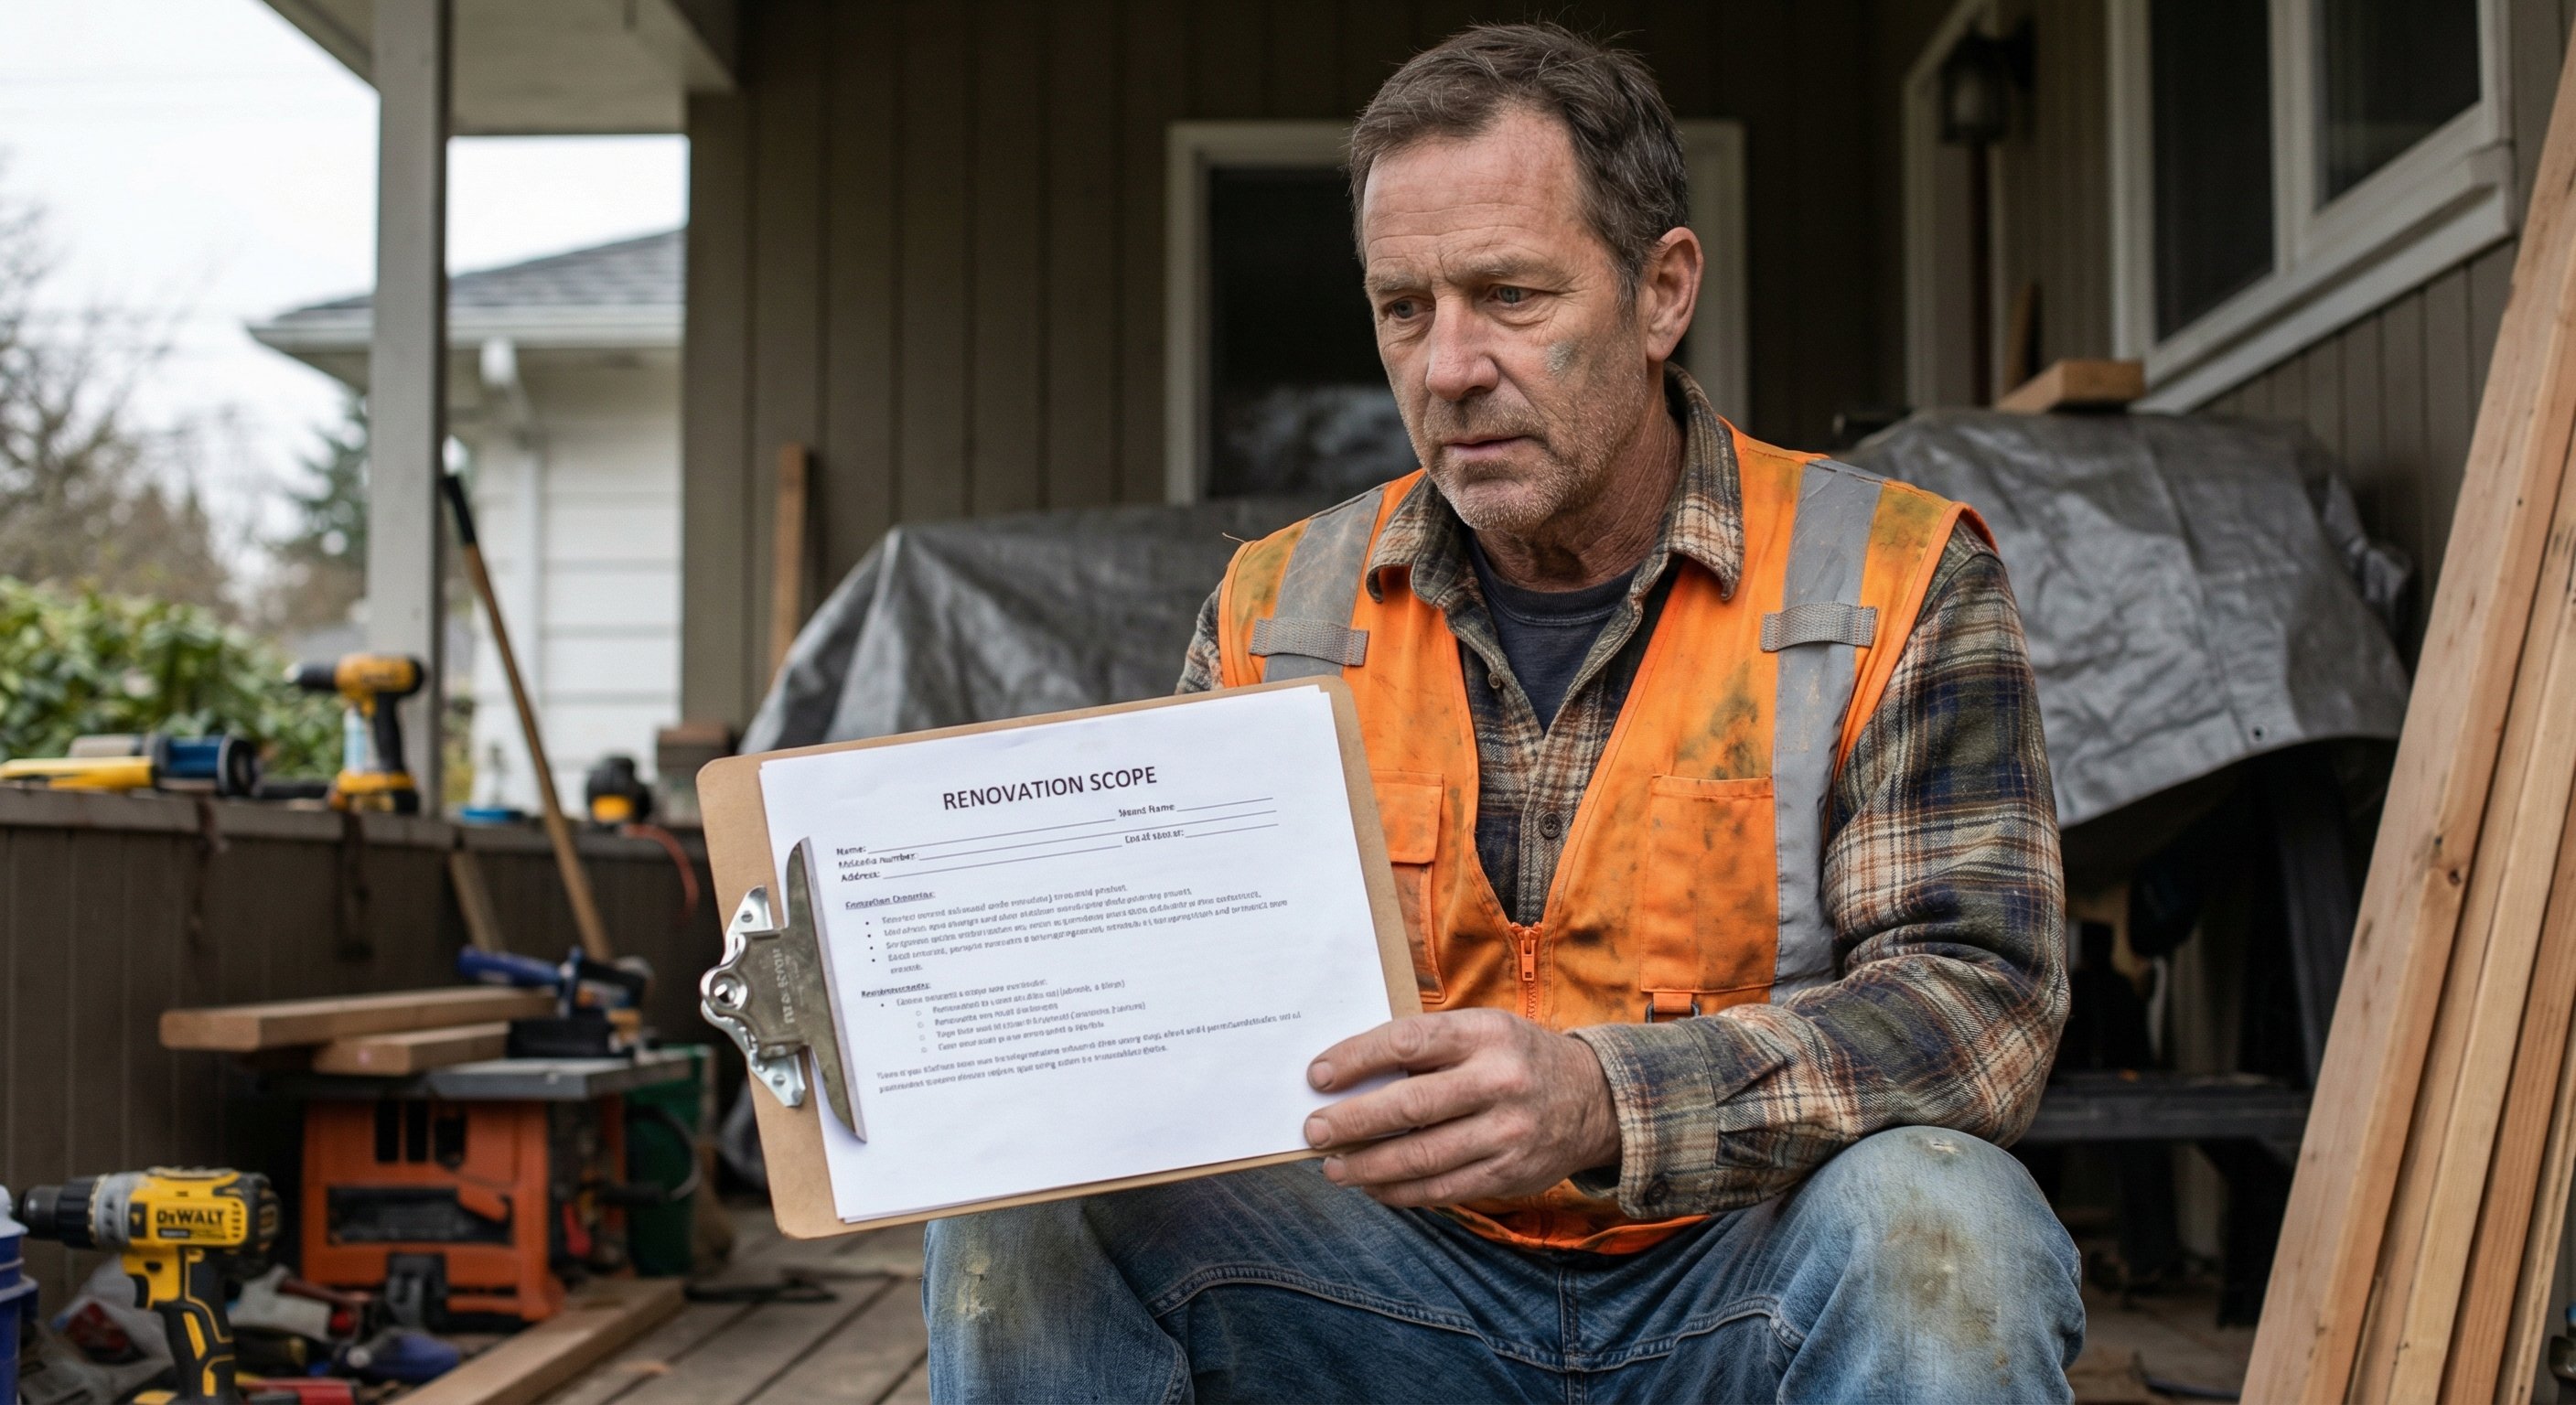
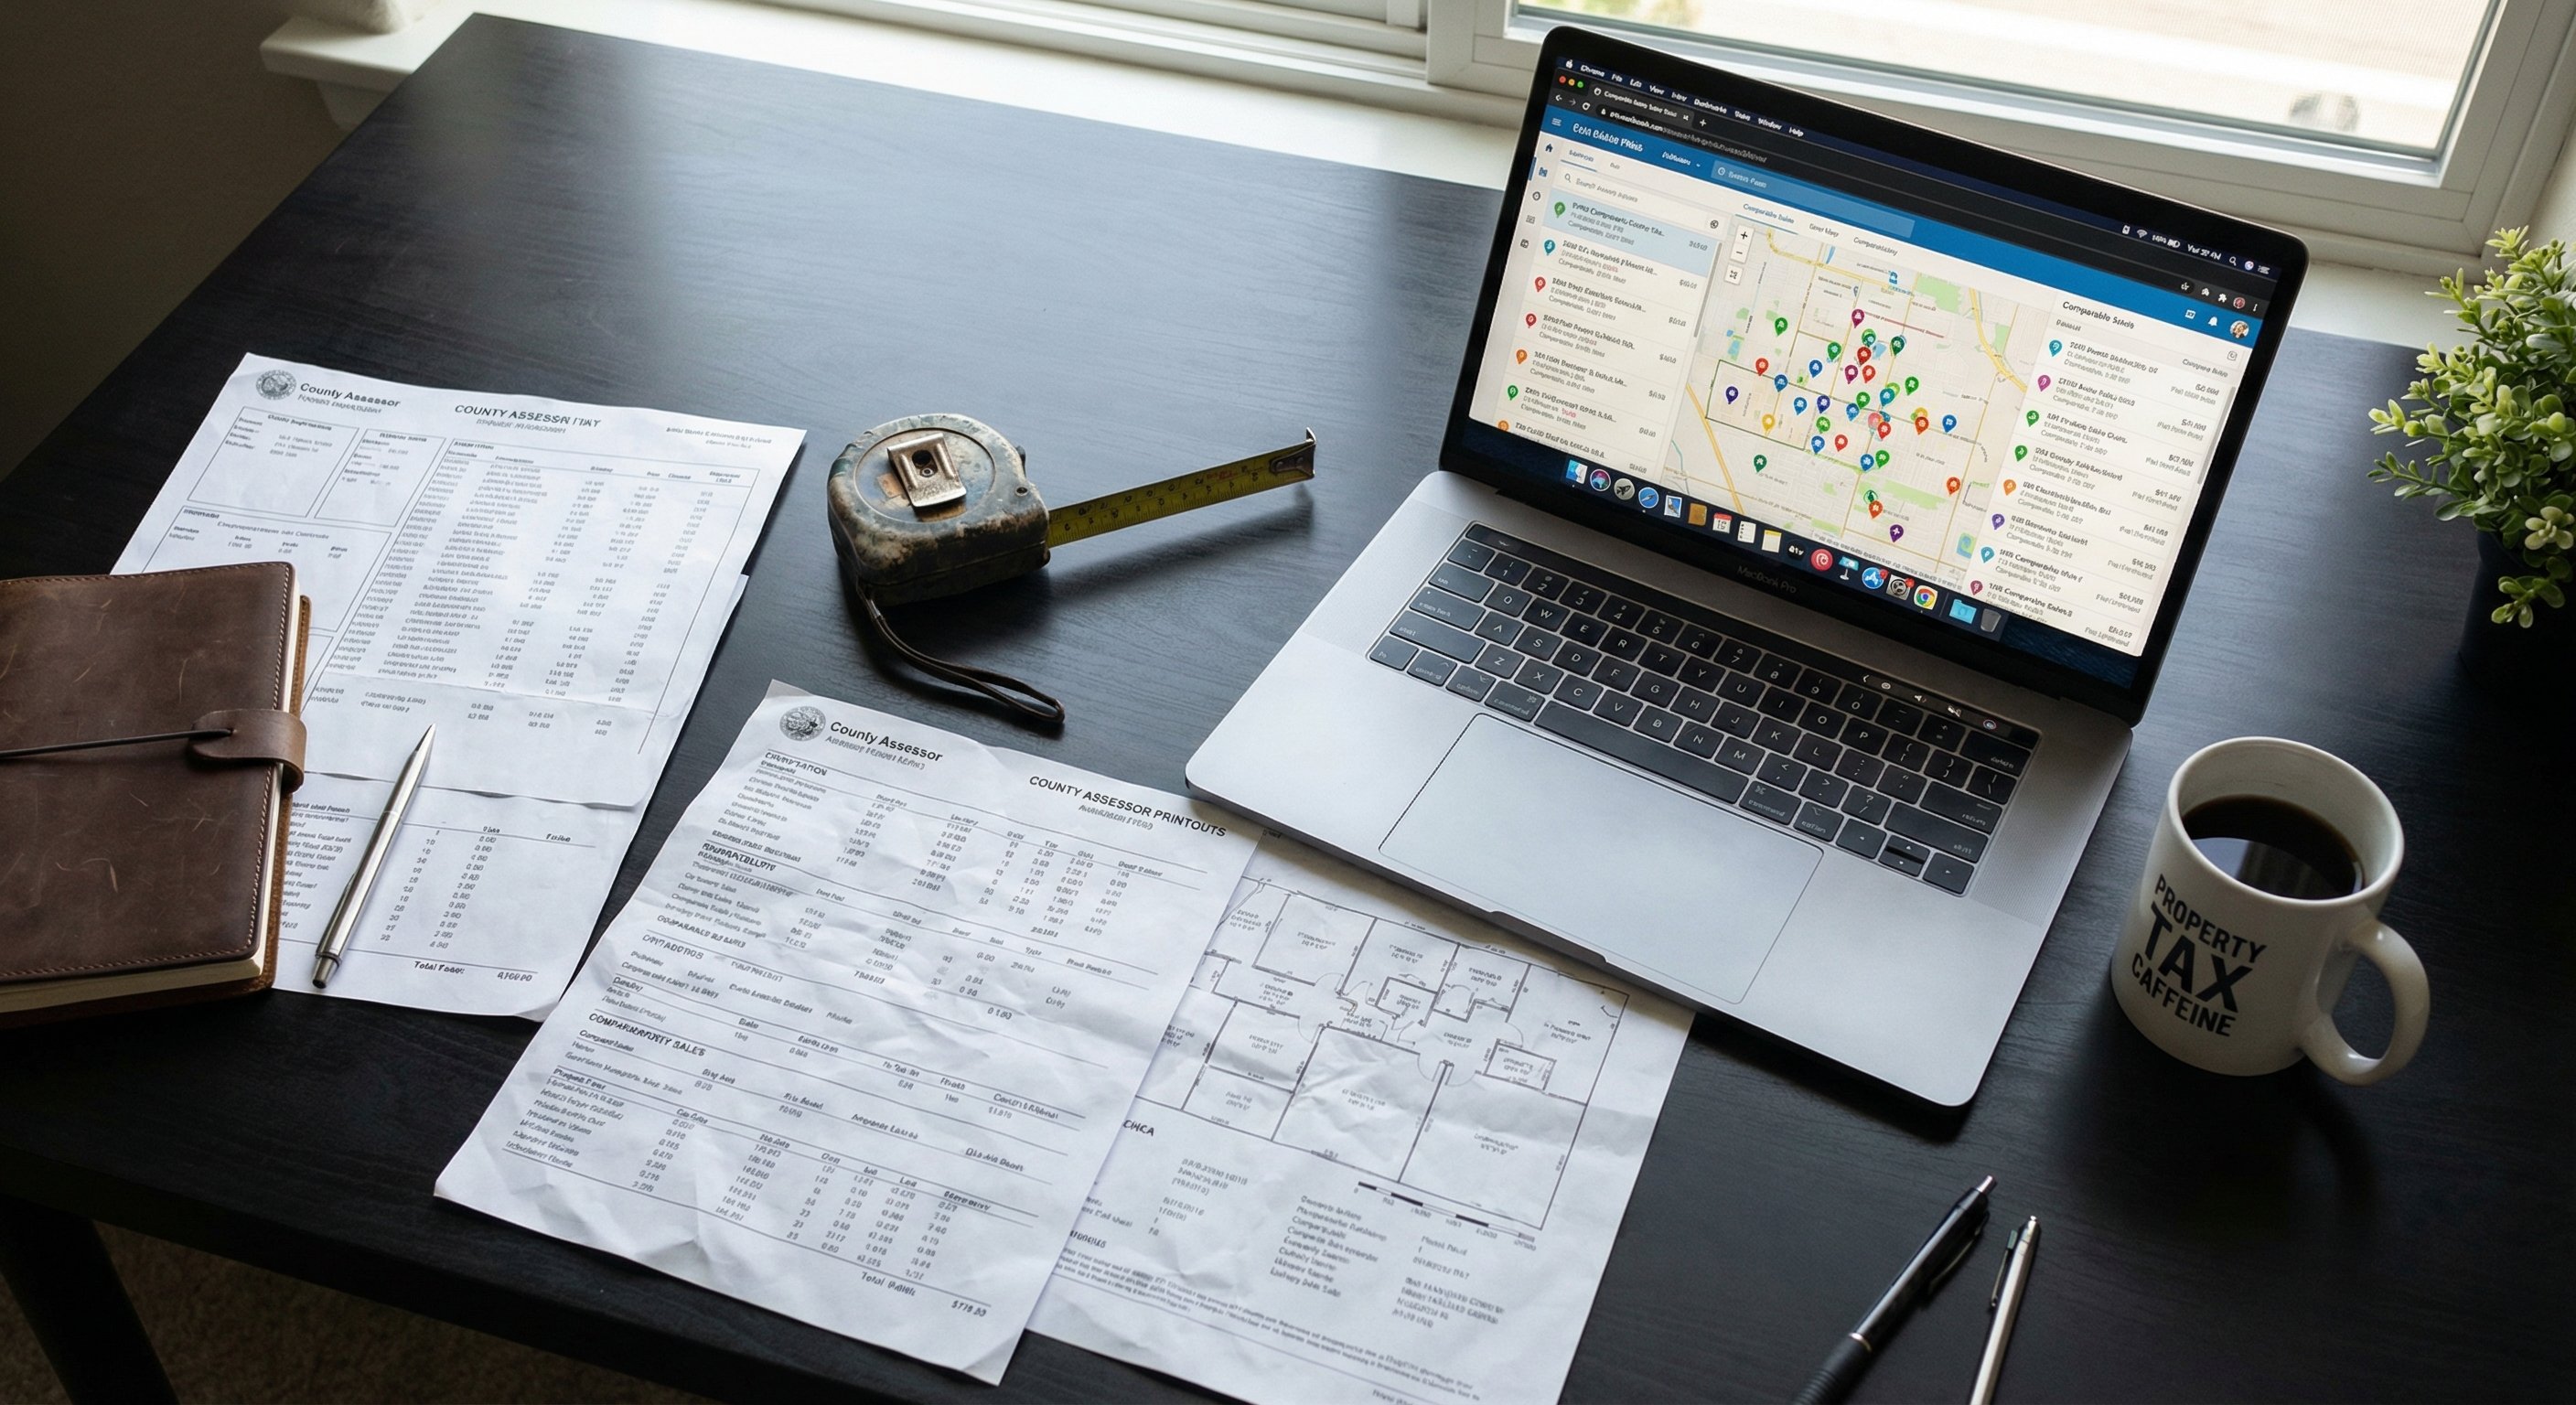
image_prompts: | IMAGE 1 (HERO - Data/Strategy): Photorealistic photograph of a clean modern desk surface with a printed property appraisal report, calculator, measuring tape, and a real estate MLS listing sheet with handwritten margin notes. Morning natural light from a window. Shot on 85mm f/1.8 lens with shallow depth of field. Real estate investment analysis photography. IMAGE 2 (Property Exterior): Wide-angle street-level photograph of a 1980s ranch home with visible deferred maintenance, faded siding, overgrown lawn, and a weathered for-sale sign. Mid-day natural light. Shot on 24mm wide-angle lens. Real estate documentary photography. IMAGE 3 (Contractor/Work): Photorealistic medium close-up of a contractor in a worn work vest and jeans, reviewing a renovation scope document clipboard on the porch of a mid-century home under renovation. Dust and minor debris visible. Catchlight in eyes. Natural skin texture. Overcast natural light. Shot on 50mm lens at f/2.0. Editorial documentary style. IMAGE 4 (Market Analysis): Photorealistic overhead flat-lay photograph of a desk with multiple county assessor printouts, a laptop showing a map with comparable sales pins, a tape measure, and a coffee cup. Dark modern workspace aesthetic. Shot on 50mm lens at f/4. Close-up product photography. IMAGE 5 (Aerial Neighborhood): Low-altitude drone aerial photograph of a suburban residential neighborhood in late afternoon light, showing a mix of well-maintained homes and one visibly distressed property with an overgrown yard and peeling paint standing out from the street. Shot on DJI Mavic 3, wide angle. Real estate aerial photography.
TL;DR: After Repair Value (ARV) represents the estimated market value of a property after all repairs and improvements are complete. Top real estate investors calculate ARV using comparable sales, adjust for current market conditions, and apply the standard 70% rule to ensure each deal leaves enough margin for profit, holding costs, and unexpected expenses. Mastering ARV is what separates profitable flippers from those who lose money on every deal.

What Is After Repair Value (ARV)?
Every profitable real estate deal starts with one question: what is this property worth after it is fixed? That number is the After Repair Value, commonly abbreviated ARV, and it is the single most important figure in any fix-and-flip or renovation investment analysis.
ARV is not a guess. It is an evidence-based estimate of a property's future market value, derived from recent comparable sales of similar homes in similar condition. The calculation drives every downstream decision in a deal: the offer price, the repair budget, the holding period, the exit strategy, and ultimately whether the deal makes financial sense at all.
For real estate investors, ARV is the anchor. Everything else in the deal flows from it.
How to Calculate ARV for Any Property
The ARV calculation begins with comparable sales, often called comps, pulled from the local Multiple Listing Service (MLS) or public county records. The goal is to find properties that have sold within the past 90 to 180 days, are geographically close to the subject property, and share key characteristics.
Step 1: Find Three to Five Comparable Sales
The most reliable ARV estimates use three to five closed comps that closely match the subject property in four key dimensions:
- Square footage: Look for homes within 200 square feet of the subject.
- Bedroom and bathroom count: Match the bedroom/bath formula as closely as possible.
- Lot size and lot configuration: Similar parcels in the same neighborhood.
- Age and construction style: Homes built within the same decade with comparable exterior materials.
DistressIQ aggregates comparable sales data across 3,200-plus counties nationwide, allowing investors to pull verified sale prices and property characteristics without sorting through fragmented public records manually.
Step 2: Adjust for Differences
No two properties are identical. After identifying base comps, experienced investors make targeted adjustments:
- If a comp has 300 more square feet than the subject, subtract value at roughly $80 to $120 per square foot depending on the market.
- If a comp has a recently renovated kitchen but the subject will not have that upgrade, adjust downward to reflect the difference.
- If the subject property has a superior lot position (corner lot, cul-de-sac, or water view), adjust upward accordingly.
Step 3: Arrive at the ARV Estimate
The adjusted sale prices of the selected comps, when averaged or range-banded, produce the ARV estimate. Most investors use a conservative midpoint rather than the ceiling of the range, building a buffer for market movement during the holding period.
For example, if three comps suggest an ARV range of $310,000 to $335,000, a conservative estimate would land at $320,000, leaving room for market fluctuation without overpromising on exit price.
The 70% Rule: Making Room for Profit
Once ARV is established, the next tool in the investor's toolkit is the 70% rule, a widely used underwriting guideline that ensures each deal carries sufficient margin. The rule states that an investor should generally not pay more than 70% of the ARV minus the estimated repair costs for any given property.
The formula looks like this:
Maximum Offer Price = (ARV x 0.70) - Estimated Repairs
Using the example above, with an ARV of $320,000 and estimated repairs of $45,000:
Maximum Offer = ($320,000 x 0.70) - $45,000 = $224,000 - $45,000 = $179,000
This means a rational investor should not offer more than $179,000 for the property in its current condition. At that price, the deal leaves roughly $41,000 in gross profit before accounting for holding costs, financing, commissions, and unexpected repair overages.
The 70% figure is a guideline, not a law. In competitive metro markets experienced investors may stretch to 75% or 80% of ARV, but only with full awareness that the margin for error shrinks accordingly.
Free Weekly Alerts
See What's Distressed in Your Market
Get free weekly alerts — new distressed properties, motivation scores, and hot neighborhoods in your area. Addresses and contact info available inside DistressIQ.
Free forever · No credit card · Unsubscribe anytime
What Drives ARV Higher or Lower
Understanding what influences ARV allows investors to spot opportunities that less experienced buyers miss, and to avoid paying for value that will not materialize.
Location and Market Microclimate
The single largest driver of ARV is location. Two properties on the same street can have dramatically different ARV estimates based on school district quality, proximity to employment centers, neighborhood vacancy rates, and recent comparable sale prices. Investors who understand hyperlocal market dynamics consistently outperform those relying on broad metro-level data.
Condition and Finish Level
A property's finish level after repairs directly determines its ARV. Renovated homes in move-in condition command a meaningful premium over partially updated homes in the same neighborhood. Understanding what finish level the local market supports prevents over-improving a property beyond what buyers will pay.
Market Timing and Absorption Rates
ARV is a snapshot, not a guarantee. In a declining market, the ARV at purchase time may be $320,000, but by the time the property is ready for resale six months later, comparable sales may have slipped to $300,000. Smart investors track months of inventory and average days on market for comparable properties as leading indicators of directional market health.
Scope of Repairs
The extent of repairs required affects both the ARV ceiling and the investor's confidence in hitting it. Properties needing structural work, foundation remediation, or major system replacements carry higher uncertainty. Investors discount these properties more aggressively or avoid them unless the purchase price reflects the elevated risk.
Using ARV to Source Better Deals
ARV is not only a valuation tool. It is a sourcing filter that separates viable deals from time-wasting prospects before an investor ever makes a phone call.
Distress Signals and ARV Correlation
Properties flagged by high distress scores often trade at significant discounts to their ARV, precisely because their condition or ownership situation makes them difficult to finance through conventional channels. Probate properties, tax-delinquent homes, and pre-foreclosure properties represent segments where the gap between current value and after repair value is widest.
For investors who know how to calculate ARV accurately, these distressed segments are where the margin lives.
Running Numbers Before Signing
Every reputable real estate investing education program emphasizes the same discipline: run the numbers before committing to any deal. The ARV-based underwriting model takes five minutes with a calculator or a spreadsheet and prevents the most common beginner mistake, which is falling in love with a property's perceived potential and forgetting to validate whether the math works.
ARV in Wholesale Deal Structuring
Wholesalers use ARV to establish the maximum allowable offer for end buyers and to demonstrate the profit potential of a deal before presenting it. A well-documented ARV analysis, complete with adjusted comps and repair estimates, gives both parties confidence that the deal has been underwritten to a rational standard.
DistressIQ provides property records, distress signal intelligence, and comparable sales data in a single interface, allowing wholesalers and fix-and-flip investors to build ARV packages faster and with greater accuracy than manual county record research would allow.
Common ARV Mistakes to Avoid
The gap between a profitable flip and a money-losing renovation is often traced back to an ARV miscalculation. The most frequent errors fall into three categories.
Using stale comps. An ARV estimate built on sales from 18 months ago can be dangerously wrong in fast-moving markets. Pull the most recent closed sales available and favor properties that went under contract within the past 90 days.
Overestimating finish level. Investors sometimes project ARV based on finishes that exceed what the neighborhood supports. A luxury kitchen in a mid-market subdivision does not generate luxury pricing. Match improvements to what comparable buyers in that price range expect.
Skipping the inspection contingency. Repair estimates during due diligence often reveal scope items not visible during the initial walkthrough. A foundation crack, asbestos wrapping, or outdated electrical panel can add tens of thousands to the repair budget. Build a contingency buffer into every estimate, typically 10% to 15% of the total projected scope.
How Technology Improves ARV Accuracy
Manual ARV research requires pulling MLS data, visiting the county assessor website, cross-referencing public records, and building a comp sheet from scratch. For investors evaluating multiple deals simultaneously, this workflow becomes a bottleneck.
Modern real estate intelligence platforms consolidate comparable sales, property characteristic data, distress signal flags, and mapping tools into a single workflow. DistressIQ overlays active and historical distress signals across 11 million-plus property records, helping investors quickly identify properties where the gap between current assessed value and after repair value creates actionable deal flow.
The practical result is faster underwriting, fewer arithmetic errors, and more confidence in offer pricing decisions.
Frequently Asked Questions
Q: What is a good ARV in real estate investing?
A good ARV is one that is supported by recent, geographically close comparable sales and leaves sufficient margin after accounting for purchase price, repair costs, holding costs, and selling commissions. The specific dollar figure matters less than the accuracy of the estimate and the spread between that estimate and the total investment cost.
Q: How do you calculate after repair value quickly?
Start by finding three to five comparable closed sales within the past 90 to 180 days. Adjust each comp for differences in square footage, bedroom/bath count, lot size, and condition relative to the subject property. Average the adjusted comps to arrive at the ARV estimate. Online ARV calculators and real estate investor software can accelerate this process significantly.
Q: What is the 70% rule in house flipping?
The 70% rule states that an investor should generally not pay more than 70% of a property's estimated after repair value minus the cost of repairs. This creates a conservative margin buffer that accounts for financing costs, holding expenses, selling commissions, and unexpected overages during the renovation process.
Q: Can you use ARV for wholesale deals?
Yes. Wholesalers regularly use ARV to establish the maximum allowable offer for an end buyer and to demonstrate the profit potential of a deal. A well-documented ARV analysis with supporting comps gives end buyers confidence that the wholesale price is grounded in market data rather than speculation.
Q: How accurate does an ARV estimate need to be?
ARV estimates do not need to be perfectly precise, but they need to be within a tight enough range that the investor's margin holds even if the final sale price comes in at the conservative end of the estimate. A reliable ARV is typically accurate within 5% to 7% of actual resale value in a stable market.
Q: What happens if the ARV estimate is wrong?
An inflated ARV leads to overpaying for a property, which compresses or eliminates profit margins and can result in a loss on the resale. An overly conservative ARV causes an investor to skip deals that would have been profitable. Consistent accuracy comes from using recent comps, making reasonable adjustments, and always building in a buffer.
The Bottom Line
After Repair Value is the foundation of every profitable real estate investment. It determines what you pay, what you spend to improve, and what you collect when the property sells. Investors who master ARV calculation and apply it consistently make better offers, avoid costly mistakes, and build track records that attract private lenders and joint venture partners.
The 70% rule keeps deals conservative. Comparable sales keep ARV grounded in reality. And the gap between current value and after repair value in the distressed property market is where patient, analytical investors consistently find opportunity.
Build the ARV habit before you build the renovation scope. The numbers come first.
DistressIQ tracks 11 million-plus active distress signals across 3,200-plus counties nationwide. Investors use the platform to identify properties where the gap between current condition and after repair value creates actionable deal flow.
Start evaluating deals with ARV-based underwriting. Browse distressed property signals at distressiq.ai.
The data behind this article
DistressIQ Monitors These Signals in Real Time
Pre-Foreclosures
NOD + NTS filings
Tax Delinquency
County treasurer records
Code Violations
Municipal inspection filings
Probate Filings
Superior Court records
Every lead is scored 0–100 for seller motivation based on signal type, duration, severity, and stacking. Nationwide coverage — every US county, updated daily.
Ready to find deals in your market?
See Live Distress Signals in Your County
Stop calling dead leads. Every lead in DistressIQ is scored 0–100 for seller motivation, with verified contact info included. Browse the free tier to see what's active in your market right now.
Browse Free Leads — No Credit Card